Use the tools in the Utilities | Statistics menu to perform various statistical computations and to generate graphs. This topic summarizes the programs that are available - click on a link or picture for more information.
![]() Back to Utilities Summary
Back to Utilities Summary
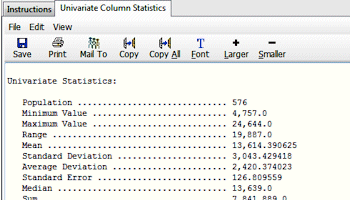
Univariate: Calculate statistics for a single column of samples in the current datasheet for output to a new datasheet, text file, Excel or Word file. More info
Normalize: Read a single column of values from the datasheet and normalize them so that they range between two user-specified values. (More info)
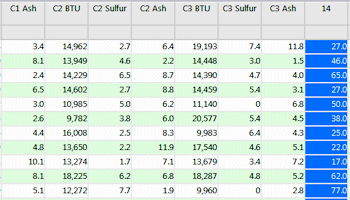
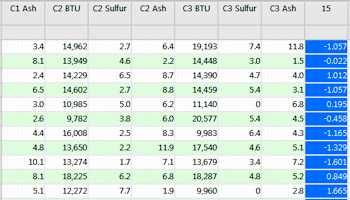
Standardize: Read a single column of values from the datasheet and calculate the mean and the deviation of each sample value relative to the mean, storing the resulting data in a new column in the datasheet. (More info)
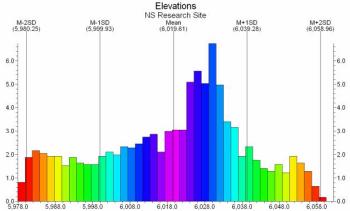
Histogram: Read a single column of data from the datasheet and determine the frequency or percentage of the total number of measurements for that variable that falls in each user-defined grouping or "cell" in a bar histogram. (More info)
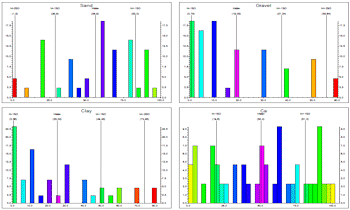
Histogram Matrix: Read two or more adjacent columns of data from the datasheet and, for each, generates a bar histogram plot. The 2+ histogram plots are combined for display in a single diagram. (More info)
Scattergram: Read two columns of numeric value from the datasheet and plot one set along the horizontal axis and the other along the Y axis, in a scattergram plot. (More info)
Ternary Diagram: Generate a trilinear diagram based on three columns of data, with optional contours (More info)
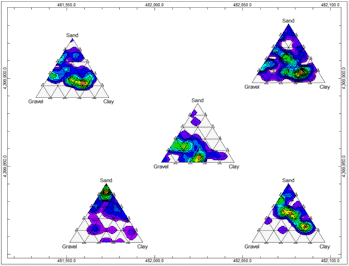
Ternary Map: Read a list of RwDat files, and generate a series of trilinear diagrams from the data in each file. The individual ternary diagrams will be displayed in a map view centered at their defined X,Y coordinates. (More info)
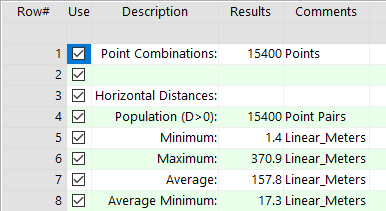
XYZ Analysis: Read X,Y or X,Y,Z point locations from the datasheet and compute a variety of statistics regarding the distribution of the points. (More info)
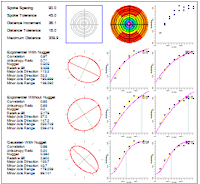
Variography: Reads XYZ data from the datasheet and generates variogram reports and graphs, showing the variability of the Z values for point pairs as a function of the distance between the points. (More info)
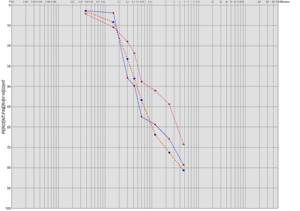
Sieve Diagram: Generates cumulative grain size distribution diagrams depicting grain size distributions for one or more samples. Also offers a simple report. (More info)
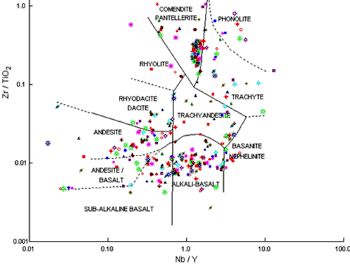
Volcanic Classification: Read Nb/Y and Zr/TiO2 from the datasheet and generate scattergrams based on whole rock trace elements in conjunction with a volcanic rock classification overlay. (More info)
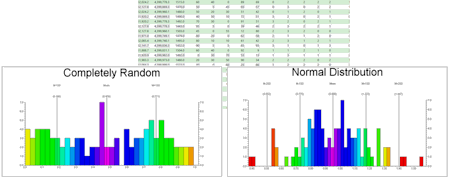
Random: Generate random numbers within a specified range, either completely random or with a normal distribution, for recording back to the main datasheet. (More info)
![]() Back to Utilities Summary
Back to Utilities Summary
![]()