RockWorks | Utilities | Statistics | Sieve Analysis
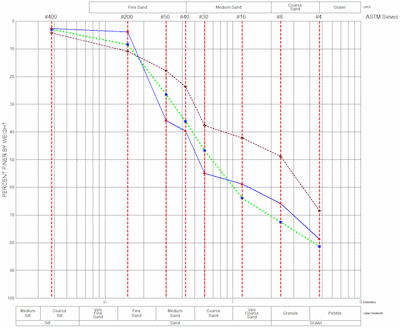
This program is used to generate cumulative grain size distribution diagrams depicting grain size distributions for one or more samples. The Sieve Analysis program menu includes a variety of options that are designed to accommodate the plethora of classification systems and screen dimensions by allowing the user to specify the directionality of the horizontal and vertical scales as well as the border annotation. It also includes annotation options that allow the user to customize the diagram.
Menu Options
Step-by-Step Summary
- Data Columns: Use these prompts to specify the columns in the current datasheet that contain the input data.
- Sample ID: Column that contains the alphanumeric sample names.
- Symbol: Column that contains the symbols that will be used when plotting the sample points.
- Line Style: Column that contains the line style that will be used when connecting the sample points.
- Total Weight: Column that contains the dry mass of the original sample before the sieving process takes place.
- First Sieve: The first (leftmost) column within the datasheet that contains the first sieve size. The program allows the user to define up to forty columns that contain various sieve sizes.
- Last Sieve: The last (rightmost) column within the datasheet that contains the final sieve size.
- Remainder: Column that contains the remaining material weight (material that was finer than the smallest mesh sieve).
- Diagram Options
- Symbols
- Size: This dimension is defined as a percentage of the diagram size. For example, a setting of 1.0 is equal to 1% of the diagram size.
- Thickness: Symbols are created by plotting a series of line segments. This setting defines the thickness of those segments. 1 = thin lines, 2 = medium, 3 = thick.
- Horizontal (X) Axis: Sub-options determine the directionality, width, and other horizontal axis plotting / scaling options.
- Upper Axis Annotation: The following options determine the type of annotation that will be displayed along the upper horizontal axis.
- Sieves Used During Analysis: This option will plot the sieve names as defined by the sieve column titles at the top of the datasheet.
- Note: The "Sieve Annotation Options" (listed at the bottom of the Horizontal Axis Upper menu) contain additional settings that effect this capability. These additional options have been grouped under this heading because they are shared with the lower-axis annotation options.
- Additional Annotation Options: There are many additional annotation options including Wentworth classification, USCS classification, millimeter annotation, etc.
- Lower Axis Annotation: The lower axis options are identical to the Upper Axis Annotation options that are described above.
- Range: The width of the diagram can be defined in one of three ways:
- Full: The horizontal axis will range from 0.001 millimeters to 500 millimeters.
-
- Automatic: The horizontal axis will be based on the range of the data.
-
- Custom: The range of the horizontal axis is determine by the following settings:
- Minimum Value: Minimum value in millimeters. The following example uses a setting of 0.02.
- Maximum Value: Maximum value in millimeters. The following example uses a setting of 10.
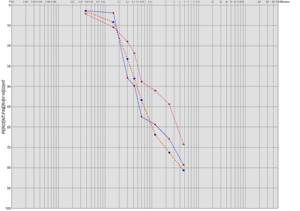
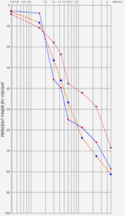
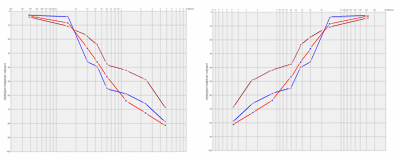
- Direction: Some users prefer horizontal axes that increase from left-to-right (see left, below) while others prefer diagrams that increase from right-to-left (see right, below).
-
- Sieve Annotation Options: These option determine how the sieve annotation (as defined by the datasheet column titles) will be plotted. These items are defined here because they're shared by the upper and lower axis annotation options.
- Annotation Title: This setting defines the text that will be plotted along the right side of the diagram. It is typically used to define the types of sieves (e.g. ASTM) that were used for the analysis.
- Font Size: This options defines the size of the sieve size annotation labels that will appear along the upper and/or lower axes.
- Include Un-Referenced Sieves: If a datasheet sieve columns does not include any data, this option can be used to make sure that the corresponding title does not appear within the diagram.
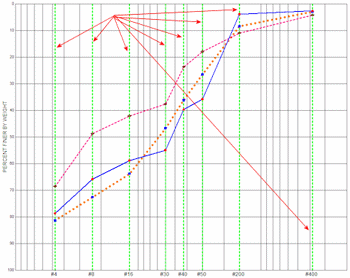
- Vertical Reference Lines: If desired, vertical lines will be drawn within the body of the diagram to indicate the sieves that were used for the analysis.
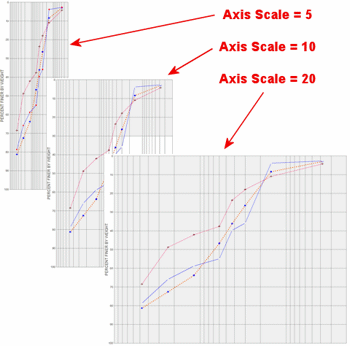
- Horizontal Axis Scale: This setting determines the scaling of the horizontal axis relative to the vertical axis. Given that the vertical axis is linear while the horizontal axis is logarithmic, a setting of 10 works well to multiply the horizontal coordinates by an order of magnitude.
-
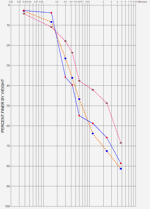
- Vertical (Y) Axis: Some users prefer vertical axes that increase from bottom-to-top while others prefer diagrams that increase from top-to-bottom. Expand this heading to select your preference.
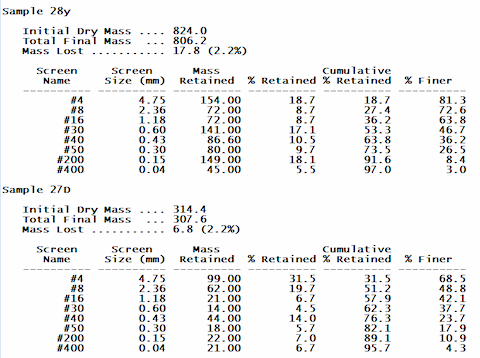
- Generate Report: This option will create a textual report and display it in an output tab. An example of the output is shown below.
-
- Access the RockWorks Datasheet program tab.
- Enter/open/import your data to be analyzed into the datasheet. See Sieve Data for information.
- Select the Utilities | Stats | Sieve Analysis menu option.
- In the displayed window, enter the requested information, discussed above.
- Click Process to proceed.
The program will read the mass measurements for the specified sieves from the listed data sheet columns. It will plot each sample's data using the requested line style and symbol, and will scale the diagram as requested.The requested diagram will be displayed in a RockPlot2D tab.
- You can adjust any of the settings in the Options window and then click the Process button again to regenerate the diagram(s).
- View / save / manipulate / export / print the diagram in the RockPlot2D window.
 Back to Statistics Menu Summary

RockWare home page