RockWorks | Utilities | Stats | XYZ Analysis
This program is used to read X,Y or X,Y,Z point locations from the datasheet and compute a variety of statistics regarding the distribution of the points. This information can be helpful in determining optimal grid node spacing (average minimum X,Y point spacing), directionality of points (azimuth), etc.
Menu Options
Step-by-Step Summary
- Data Columns: Use these prompts to define the columns in the data sheet that contains the requested input values.
- X (Easting): Select the column in the data sheet that contains the X or Easting coordinates for the points.
Be sure you've defined your coordinate system and units; see Defining your Datasheet Coordinates for more information.
- Y (Northing): Select the column that contains the Y or Northing coordinates for the points.
- Z (Elevation): Select the column that contains the elevation coordinates for the points. This column will be used only if you activate the Include Z Value (3D) checkbox, below. If you don't have elevation values, the program can compute statistics for X,Y points only.
! Note: The input data may be in mixed units (e.g. X and Y can be in UTM meters while the Z can been in feet). It will be automatically converted to the specified Project Output Units.
- Point Distances
- Include Z value (3D): Insert a check in the box if you have elevation data values which are defined as an input column (as described above) AND you wish to compute 3D distances and inclinations. If you wish to compute X and Y distances only, you can leave this box unchecked.
- Output Options
Click this tab to define the output format(s) for the report. (More info)
- RwDat (RockWorks): Click in this button if you want the report generated in a RockWorks datasheet (.RwDat) format.
- CSV (Excel): Click in this button if you want the report generated in a CSV file format for use in Excel.
- TXT (Notepad): Click in this button if you want the report generated in a text (.txt) format.
- RTF (Word): Click in this button if you want the report generated in an RTF file format for use in Word.
- Access the RockWorks Datasheet program tab.
- Enter/open/import your data to be analyzed into the datasheet.
- Select the Utilities | Stats | XYZ Analysis menu option.
- In the displayed dialog box enter the requested information, discussed above.
- Click the Continue button to process.
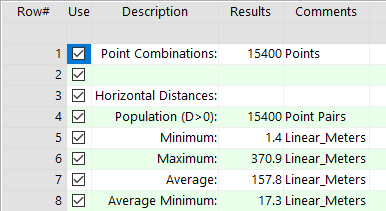
- The program will perform a variety of calculations on the data points in the enabled (checked) rows in the datasheet, and display the results in the requested output format(s) which can include the following calculated statistics:
- Combinations: The number of X,Y or X,Y,Z pairs the program encountered.
- Horizontal Distance: The minimum, maximum, average, and average minimum horizontal distance between the points, in 2D.
- Azimuth: The minimum, maximum, and average azimuth bearing between the point pairs.
- 3D Distance: The minimum, maximum, average, and average minimum distance between the points in 3D, if requested.
- Vertical Distance: The minimum, maximum, average, and average minimum vertical distance between the points, if 3D calculations were requested.
- Inclination: The minimum, maximum, and average inclination in degrees from horizontal (positive = above horizontal, negative = below horizontal) between the point pairs, if 3D calculations were requested.
 Back to Statistics Menu Summary

RockWare home page