RockWorks | Utilities | Statistics | Volcanic Classification
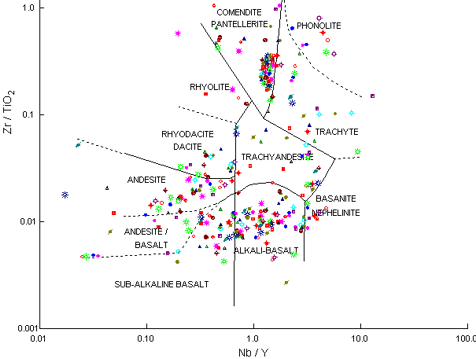
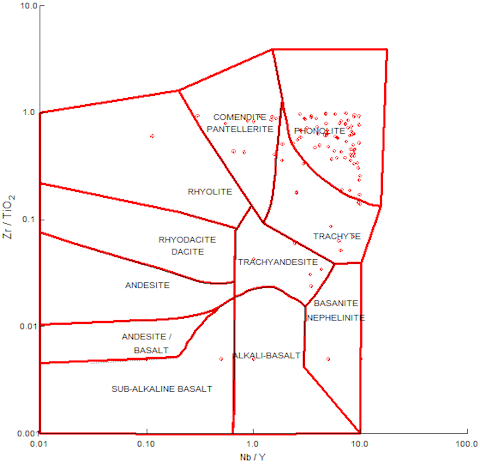
This program generates Nb/Y versus Zr/TiO2 scattergrams based on whole rock trace elements in conjunction with a volcanic rock classification overlay (Winchester, J. A., and Floyd, P. A., 1977, Geochemical discrimination of different magma series and their differentiation products using immobile elements, Chemical Geology, vol.20, pp.325-343.).
Menu Options
Step-by-Step Summary
- Data Columns: Use these prompts to specify the columns in the current datasheet that contain the input data.
- Input
- Nb/Y: Select the name of the column that contains the Nb/Y measurements.
- Zr/TiO2: Select the column that contains the Zr/TiO2 measurements.
- Symbols: (optional) Select column that contains the symbols that will be used when plotting the sample points. If you don't have symbols listed in the datasheet you can assign a uniform symbols style for the points.
- Output
- Classification: Select the column where the classification terms, if requested will be recorded. Note that any existing data in this column will be overwritten.
- Create Diagram: Insert a check here if you want to create a classification diagram. Click on this tab to set up the diagram options.
- Plot Symbols: Check this option to display the samples with symbols in the output graph.
- Uniform: Select this option to plot a specific symbol for all samples. Click the image to select the desired symbol style and color.
- Column-Based: Select this option if you have a symbol listed for each sample in the current datasheet. Be sure you've selected that symbol column name under Data Columns, described above.
- Size: The symbol dimension is defined as a percentage of the diagram size. For example, a setting of 1.0 is equal to 1% of the diagram size.
- Thickness: Symbols are created by plotting a series of line segments. This setting defines the thickness of those segments. 1 = thin lines, 2 = medium, 3 = thick.
- Connect Points with Lines: Check this this box to activate the plotting of a line between points, in the order in which they are listed in the datasheet. Click the box to select line style and color.
- Classification Polygons: Check this item to include in the diagram the polygons which illustrate the classification zones.
-
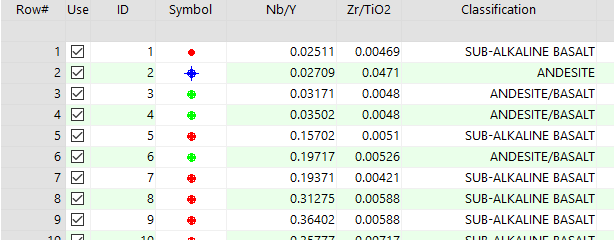
- Classify Points: Check this box for the program to record in the Output Column (defined above) the rock classification.
-
- Other 2D Files
Check this option to include existing RockWorks diagrams as layers with the current diagram.
Click on this tab to select the existing diagrams (.Rw2D files) to be included. (More info)
- Peripherals
Check this option to include various peripheral annotations with your diagram. Options include titles, and more.
Click on this tab to activate the items and establish their settings. (More info)
- Border
Check this option to include a solid line border around the entire diagram.
Click on this tab to specify the line style, thickness, and color.
- Output Options
- Save Output File: Check this to assign a name for the diagram in advance, rather than displaying it as Untitled.
- Automatic: Choose this option to have RockWorks assign the name automatically. It will use the name of the current program plus a numeric suffix, plus the ".Rw2D" file name extension.
- Manual: Choose this option to type in a name of your own for this file.
- Display Output: Check this option to have the resulting diagram displayed in RockPlot2D once it is created.
- Access the RockWorks Datasheet program tab.
- Enter/open/import your data to be analyzed into the datasheet.
- Select the Utilities | Stats | Volcanic Classification menu option.
- In the displayed window, enter the requested information, discussed above.
- Click Process to proceed.
The program will read the measurements for the specified data columns, classify the samples, and generate the diagram if requested, for display in a RockPlot2D tab. It will also list the mineral classification in the datasheet, if requested.
- You can adjust any of the settings in the Options window and then click the Process button again to regenerate the diagram and classification data.
 Back to Statistics Menu Summary

RockWare home page