RockWorks | Utilities | Stats | Univariate
This program is used to calculate statistics for a single column of samples in the current datasheet. Data may be filtered out when an appropriate filter range is selected.
Menu Options
Step-by-Step Summary
- Data Columns (Input): Click on this item to select the name of the column in the current data sheet that contains the numeric values for which statistics will be calculated.
- Titles: Click here to specify report titles.
- Primary: Enter the text to be plotted as the primary title at the top of the Statistics Report. The text should be limited to 80 characters. If no title is desired, delete any text that's displayed there.
- Secondary: Enter the text to be plotted as the secondary title beneath the Primary Title at the top of the Statistics Report. The text should be limited to 80 characters. If no title is desired, delete any text that's displayed there.
- Filter: Click on this tab to turn on/off a value filter on the data to be processed.
- Minimum value: Insert a check in this box to turn on a low-value filter. Enter the minimum value for the data to be processed.
- Maximum value: Insert a check here to activate a high-value filter. Enter the maximum value for the data to be processed.
- Output Options
Click this tab to define the output format(s) for the report. (More info)
- RwDat (RockWorks): Click in this button if you want the report generated in a RockWorks datasheet (.RwDat) format.
- CSV (Excel): Click in this button if you want the report generated in a CSV file format for use in Excel.
- TXT (Notepad): Click in this button if you want the report generated in a text (.txt) format.
- RTF (Word): Click in this button if you want the report generated in an RTF file format for use in Word.
- Access the RockWorks Datasheet program tab.
- Enter/open/import into the datasheet the data to be analyzed.
- Select the Utilities | Stats | Univariate menu option.
- Enter the requested information, discussed above.
- Click Process to continue.
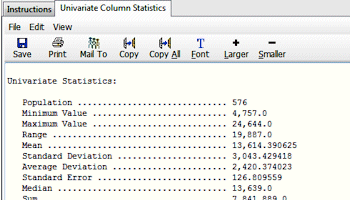
The program will perform a variety of calculations on the user-defined range of data and display the results in a report which will include the following calculated statistics:
- Population: The number of values the program found for the selected data which fell within the specified filtering range and which were included in the statistics calculations.
- Minimum Value: The minimum value for the data included within the calculations.
- Maximum Value: The maximum value for the data included within the calculations.
- Range: The min-to-max value range.
- Mean: The arithmetic average of the sample data, equaling the sum of the values divided by the number of measurements.
- Standard Deviation: A measurement that indicates the way in which the data is centered around its mean, equal to the positive square root of the variance of the sample.
- Standard Error: A measurement that indicates the variability that can be expected in the means computed for samples taken randomly from the same population.
- Median: The value that is in the middle of the frequency distribution of the data.
- Sum: The total of all data included within the calculations added together.
- Square Root of Sum: The arithmetic square root of the total of all data included within the calculations added together.
- Sum Squared: The value of the total of all data included within the calculations added together and multiplied by itself.
- Variance: The measured degree of difference between all data included within the calculations.
- Deleted Points: The number of measurements that were excluded from the calculations because they fell outside a specified filtering range.
- Statistical cutoff data, such as Mean + and - 1 Standard Deviation, 2 Standard Deviations, 3 Standard Deviations, and the populations represented within these groupings.
- Once the statistics have been calculated, save/print/close the output windows(s) as desired.
 Back to Statistics Menu Summary

RockWare home page