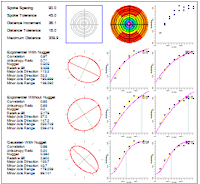
Use this program to read XYZ data from the RockWorks datasheet and generate variogram reports and graphs, showing the variability of the Z values for point pairs as a function of the distance between the points. RockWorks creates observed variograms of your data, and then finds the variogram model that offers the best fit - thus defining the distance and directional relationships in your data.
These tools are the same as those offered with the Kriging gridding method.
Feature Level: RockWorks Basic and higher
See also: What is a Variogram, Kriging
Menu Options
Step-by-Step Summary
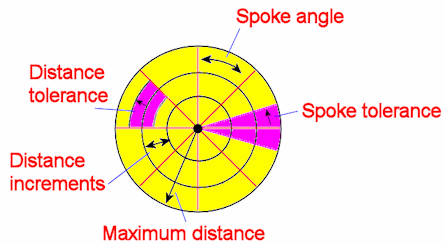
If you've selected Automatic variography, the program will compute the average minimum and maximum spacing of your control points, to suggest default sampling distance increments and total distance. It will search for point pairs at 90 degree spoke increments using these lag bins, and then at successively smaller spoke increments, pitching bins without a minimum number of samples. It will compute the observed variograms for all spoke samples, and will determine the variogram model that has the best correlation.
If you've selected Manual variography, the program will search for point pairs along the spoke and distance increments you've specified, out to the maximum distance, and will compute the observed variograms for these bearings. It will fit the selected variogram model to the data.
If you have requested to Edit / Examine Variogram, the best-fit variogram model will be displayed, along with a reference range plot. Adjust this as you wish, and click OK. (See Examining and Editing Variograms for details.)
If you've requested the text report or 2D variogram matrix, they will be displayed in a text tab and/or a RockPlot2D tab in the Options window.
![]() Back to Statistics Menu Summary
Back to Statistics Menu Summary
![]()