RockWorks | Borehole Operations | Striplogs | Datasheet -> Borehole Survey
This program is used to read depths, bearings, and inclinations from the RockWorks datasheet, and compute XYZ coordinates at user-specified intervals down the borehole that are recorded in a new datasheet. It also offers 2D and 3D diagram views of the deviated borehole.
Feature Level: RockWorks Basic and higher
Menu Options
Step-by-Step Summary
- Data Columns:
- Depth: Select the column in the current datasheet where the depth measurements are listed. Be sure you have your units defined.
- Bearing: Select the column in the input file where the survey bearings (in 0 - 360 degree azimuth) are listed.
- Inclination: Select the column in the input file where the inclinations of the drillhole are listed.
- Collar & TD
- Collar Location:
- X (Easting), Y (Northing), Z (Elevation): Type in the X, Y, and elevation at the top of the hole.
! It’s important that the X and Y location coordinates and the elevations are recorded in the same units, such as meters or feet, and that they match the depth units listed in the input file.
- Total Depth:
- Automatic: Choose this option if the total depth of the hole should be set automatically to the deepest survey point listed in the data file.
- Manually Specified: Choose this to enter the TD of the hole. Enter the depth into the prompt.
- Directionality
- Magnetic Declination Correction: Enter any declinaton correction as described in the program dialog.
- Inclination: Select the format of the inclination measurements you have entered. Choose from:
- Up = 90 Degrees, Horizontal = 0 Degrees, Down = -90 Degrees
- Up = 0 Degrees, Horizontal = 90 Degrees, Down = 180 Degrees
- Resolution: Enter the interval at which you want XYZ coordinates computed, recorded in the datasheet, and displayed with symbols on the output diagram.
- XYZ List: Insert a check in this box if you want the program to create an output report in which it will record the computed X,Y, and Z coordinates of the downhole survey, at the increments specified above.
- List Options
- Report Increments: Choose whether the output report should include XYZ calculations for each increment (defined above) or for each depth declared in the Orientation table.
- Decimals: Select the number of decimal places for the calculated coordinates.
- Output Options
Click this tab to define the output format(s) for the report. (More info)
- RwDat (RockWorks): Click in this button if you want the report generated in a RockWorks datasheet (.RwDat) format.
- CSV (Excel): Click in this button if you want the report generated in a CSV file format for use in Excel.
- TXT (Notepad): Click in this button if you want the report generated in a text (.txt) format.
- RTF (Word): Click in this button if you want the report generated in an RTF file format for use in Word.
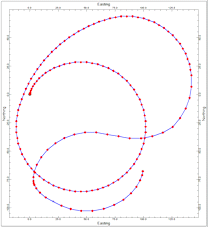
- Plan Map
Check this to create a plan-view map of the borehole survey trace. Click on this tab to set up the map.
- Symbols: Click on this tab to set up the symbols for the survey map.
- Plot Collar Symbol: Check this item to plot a symbol at the collar location.
- Symbol: Click the Symbol sample to choose the symbol style and color.
- Size: Type in a size for the collar symbol, as a percent of your project extents.
- Plot Symbols at each Survey Point: Check this box to plot a symbol at each survey point along the borehole, as listed in the hole's Orientation table.
- Symbol: Click the Symbol sample to choose the symbol style and color.
- Size: Type in a size for the survey symbols, as a percent of your project extents.
- Plot Symbols at each XYZ Point: Check this box to plot a symbol at each calculated XYZ point along the borehole, whose interval is defined above.
- Symbol: Click the Symbol sample to choose the symbol style and color.
- Size: Type in a size for the XYZ symbols, as a percent of your project extents.
- Connect XYZ Points with Polyline: Check this box to plot a line between the XYZ points which are calculated along the borehole. Click the sample to choose a line style, thickness, and color.
- Other 2D Map Options
Use these checkboxes to append other layers to your map.
Click each tab to set up the 2D map layers (background image, labeled axes, peripherals, etc.).
- Output Options: Use these settings to define whether the output graphic is to be saved (or displayed as "untitled"), how the file should be named, and whether it is to be displayed after it is created. It also offers export options. (More info)
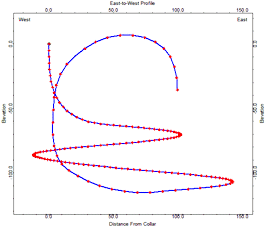
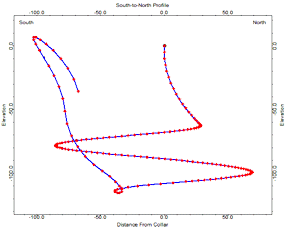
- Profiles
Check this box to create two profile diagrams of the deviated drill hole. Click on this tab this to establish the settings.
- Symbols: Click on this tab to set up the symbols for the survey profile.
- Plot Collar Symbol: Check this to display the start of the survey trace with a specific symbol.
- Symbol: Click the Symbol sample to choose the symbol style and color.
- Size: Type in a size for the collar symbol, as a percent of your project extents.
- Plot Symbols at each Survey Point: Check this box to plot a symbol at each survey point along the borehole, as listed in the hole's Orientation table.
- Symbol: Click the Symbol sample to choose the symbol style and color.
- Size: Type in a size for the survey symbols, as a percent of your project extents.
- Plot Symbols at each XYZ Point: Check this box to plot a symbol at each calculated XYZ point along the borehole, whose interval is defined above.
- Symbol: Click the Symbol sample to choose the symbol style and color.
- Size: Type in a size for the XYZ symbols, as a percent of your project extents.
- Connect XYZ Points with Polyline: Check this box to plot a line between the XYZ points which are calculated along the borehole. Click the sample to choose a line style, thickness, and color.
- Perimeter
- Annotation Size: This determines the size of the text labels along the border, as a percent of the project size. Default = 2
- Horizontal Annotation Intervals: Choose Automatic or Manual. For the latter you can specify the number of map units at which tick marks and labels are to be plotted along the horizontal axes of the profiles.
- Vertical Annotation Intervals: Choose Automatic or Manual. For the latter you can specify your depth units at which the ticks and labels are to be plotted for the vertical axes.
- Output Options: Use these settings to define whether the output graphic is to be saved (or displayed as "untitled"), how the file should be named, and whether it is to be displayed after it is created. It also offers export options. (More info)
- 3D Diagram
Check this to output a 3D display of the hole. Click this tab to set up the 3D output.
- 3D Options
- Borehole Radius: Specify the radius of the 3D tube, as a percent of the project size. Default = 2.
- Borehole Color: Choose Monochrome (and select a color for the tube) or Random (for which each tube segment will be assigned a different color).
- Vertical Lines to Horizontal Plane: Check this to plot a line from each segment endpoint to a specific elevation: The highest elevation in the diagram, the lowest elevation, or a user-defined elevation. Note that the number of vertical lines will correspond to the resolution of the computed survey, established above.
- Other 3D Diagram Options
Use these checkboxes to append other layers to your 3D scene.
Click each tab to set up the 3D diagram layers (images, infrastructure, reference cage, etc.).
- Output Options: Use these settings to define whether the output scene is to be saved (or displayed as "untitled"), how the file should be named, and whether it is to be displayed after it is created. It also offers export options. (More info)
- Access the RockWorks Datasheet program tab.
- Create a new datasheet and enter or import your downhole survey data into the datasheet.
Or, open one of the sample files and replace that data with your own.
! Click the Example button to the left to load a sample file that is installed with the program.
- Select the Borehole Operations | Datasheet - Borehole Survey menu option.
- Enter the requested menu items, described above.
- Click the Continue button on the left side of the window to continue.
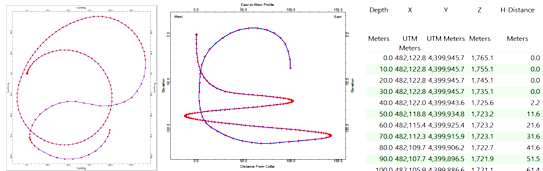
The program will read the well location and downhole survey information from the database. It will determine the downhole trace of the drill hole, and will calculate the X, Y, and elevation coordinates at the specified interval down the hole. If requested, it will list these computations in an XYZ List report. If requested, the 2D plan map and/or vertical profiles will be generated and displayed in RockPlot2D tab(s) in the window. If requested, the 3D diagram will be displayed in a RockPlot3D tab.
- You can adjust any of the settings in the main Options tab to the left and click the Continue button again to regenerate the data or diagrams.
- View / manipulate / save the report and/or diagrams.
TIP: The accuracy of the calculations is dependent upon the resolution settings defined in the Settings | Preferences window. See the discussion of Computational Resolution in that topic.
 Back to StripLogs Menu Summary

RockWare home page