- Automatic: Click in this radio button if you want the program to set the kriging variables automatically for you (probably the best place to start). When set to Automatic, the program will determine the variogram type to use, based on the type with the highest correlation with your data. It will search the data using a variety of spoke directions and variogram types.
- Manual: Click this button if you prefer to set the kriging variables manually.
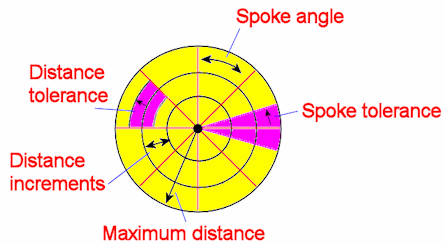
- Spoke Spacing: Since variograms represent point-to-point variability, the program creates a set of point pairs to work with. Rather than analyzing all possible pairings between all data points (a huge number), the program will sample point pairs along specific directional bearings. These bearing lines can be conceptualized as bi-directional "spokes" running through the data points; you define the spacing in degrees between sampling spokes. For example, a 45 degree spoke spacing will generate 4 bi-directional spokes (180 / 45 = 4), and a 30-degree spoke spacing will generate 6 spokes.
- Spoke Tolerance: Since it is unlikely that many data points will lie along the narrow directional lines established above, you need to establish a "tolerance" or zone alongside each bearing line to include in the data point search. The default is 22.5 degrees.
- Distance Increments: In addition to the program searching for data points in a directional manner, it also searches in an orderly, step-wise manner, along each bearing line at certain distance increments. These are expressed in map units. The default is 250.
- Distance Tolerance: It is unlikely that data points lying within the directional search zone will fall right on one of the distance increments, so it is necessary to establish a tolerance zone around each increment to widen the search area. This is also expressed in map units. The default is 125.
- Maximum Distance: This variable establishes the maximum distance from each data point that the data search will be conducted, in map units.
- Variogram: Use this drop-down menu to select the variogram model to apply to the gridding process.
How to know? Here are some suggestions.
- Click in the Edit / Examine Variogram check-box (below) to bring up an interactive window where you can actually fit different variograms to your data.
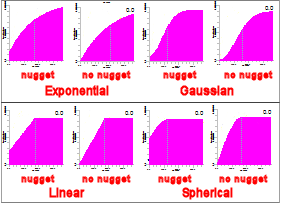
- Activate the 2D Variogram Matrix option (discussed below) to view a series of variograms and look for the best fit.
- Keep it simple: You can start with a Linear no Nugget model. This indicates that there is a linear relationship between distance and point variability, and that there is not a great sampling error.
- Try them out: Try several variogram models and compare the resulting maps. Which looks best to you? For example, if you create a triangulation-based, and inverse distance-based, and linear kriging-based contour map of the same data, you can get an idea of the study area (and the variability within it!). You can create maps using other kriging-based variogram models and compare them.
- Pre-Grid Points for Variogram: This setting tells RockWorks to first create a regular grid of points (using Inverse-Distance squared) which will then be used for generating the variogram. Keeping this turned on can create better variograms for small data sets. Turning this off can help create a better match between Automatic and Manual settings.
- Edit / Examine Variogram: Check this box to see the interactive Variogram Editor prior to gridding.
- Textual Report: Check this box to generate a textual report that list the various kriging parameters that were used to create the grid model.
- 2D Variogram Matrix: Check this box to generate a detailed diagram that depicts all of the variograms, and a large number of other statistics. (More info)
- Items: Use these check-boxes to select which variogram models you wish to include in the matrix diagram.
- Variograms per Row: Defines the maximum number of variograms to be plotted per row, for each activated variogram type. Default = 10.
(Typically you won't have that many. For a 90 degree spoke spacing, you'd have two variograms per model. For a 45 degree spoke spacing, you'd have 4.)
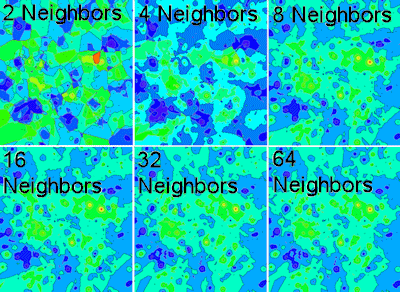
- Neighbors: Kriging is the process of determining the weights to assign the given data points to minimize the error in grid node assignment, based on the selected variogram. This prompt permits you to specify just how many data points will be used and weighted in estimating the value for a given grid node. A typical value is "6"; the greater the value, the more regional the gridding. The maximum number you can choose is 64. Using more neighbors can result in a smoother, less polygonal model.