What is "Lithology"
In RockWorks, "lithology" data represents your downhole rock or material types that aren't necessarily layered in a specific order. The Lithology entries can repeat (sand, clay, sand, clay). "Observed" is the key word. Observed lithology intervals for each borehole are entered into the Lithology tab, listing depth to top, depth to base, and rock or material type. This is what many people initially enter.
This means that if you do not initially know the regional stratigraphy, and cannot define discrete layering, you can still plot observed lithology in logs and log-based cross-sections.
You can use the Pick Intervals program to interactively pick lithology intervals from a geophysical (or other) cross-section.
How Lithologies are Defined
RockWorks stores in each project database a Lithology Types Table, where you define the names of the rock or material types, the colors and patterns to be used to represent them in logs and diagrams, and some additional settings. See the discussion of Lithology Types Tables for more details.
How Lithologies are Modeled
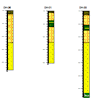
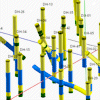
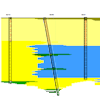
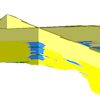
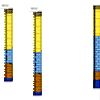
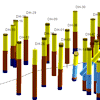
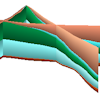
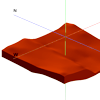
RockWorks allows you to enter repeating lithology intervals within individual boreholes, so they cannot be modeled using surfaces. (You can't create a single surface for the top of a Sand layer, for example, if there are three "Sand" entries for a well.) Because of this, lithology data is modeled using solid modeling techniques, whereby the rock types basically "bleed" out from the boreholes into the surrounding space. This allows RockWorks to create panel sections / fences and block models representing interpolated material types, using the tools in the Borehole Manager’s Lithology menu. We show below some images created with program in the Striplogs menu (observed data only) and Lithology menu (interpolated data). Click on an icon to link to its help topic.
If you want to try to group your lithologies into interpreted stratigraphic units, you can do so by hand, or using the Pick Contacts tool in the Stratigraphy menu that allows you to view a lithology (or geophysical) cross section and point-and-click to record stratigraphy depths.
What is "Stratigraphy"
These are interpreted formations, often groups of lithologies, which are distinctly layered in nature, are consistent between wells in their order from the surface downward, and never repeat within a borehole. Interpreted stratigraphy is entered into the Stratigraphy tab, with depth to formation top, depth to base, and formation name.
You can use the Pick Contacts program to interactively pick stratigraphic sequences from a geophysical (or other) cross-section.
How Stratigraphy Units are Defined
RockWorks stores in each project database a Stratigraphy Types Table , where you define the names of the ordered rock units or layers, the colors and patterns to be used to represent them in logs and diagrams, and some additional settings. See the discussion of Stratigraphy Types Table for more details.
How Stratigraphy is Modeled
Because stratigraphic units are distinctly layered, you can request simple log-to-log correlations (no modeling) in hole to hole or "straight" log sections.
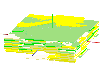
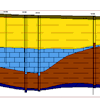
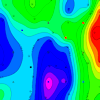
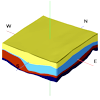
RockWorks can interpolate surface models of each stratigraphic layer for 2D and 3D display; for slicing as profiles, sections, and fences; and for stacking as solid model diagrams. We show below some images created by tools in the Striplogs menu (observed data only) and the Stratigraphy menu (interpolated data).
| Lithology |
Stratigraphy |
| Represents observed rock type. |
Represents interpreted layers or formations. |
| Is often the first step in entering borehole rock types |
Is often the second step in entering borehole rock types. |
| Can contain repeated sequences (sand, clay, sand, clay) |
Cannot contain repeated sequences. |
| Rock types can vary in order between wells. |
Stratigraphy layers must be consistent in order, from the top down, between wells. |
| No lateral variability |
Often has lateral variability. |
| Data is entered into each borehole's Lithology data tab |
Data is entered into each borehole's Stratigraphy data tab |
| Rock types are defined in a Lithology Table |
Rock types are defined in a Stratigraphy Table |
| No simple correlation is possible in hole to hole cross sections. |
Simple correlations are possible in hole to hole cross sections. |
| Is interpolated as a solid model, for display as slices, fences, or block diagrams |
Is interpolated as surface models for display as maps, 3D surfaces, slices, fences, or block diagrams. |