Borehole Operations | Striplogs | 2D Striplog Section
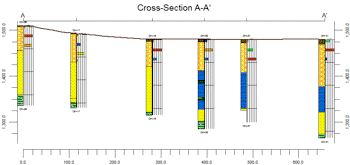
Use this program to create a 2-dimensional vertical display of strip logs of multiple boreholes, displaying observed data entered into the borehole data tables. The logs can include any combination of the available log items. The completed cross section will be displayed in the RockPlot2D window.
! Logs in hole-to-hole sections are always plotted as vertical. See What is a Hole to Hole Section? for details. See Displaying Multiple Logs in a 2D Log Profile for details about projected log profile diagrams which will display inclined/deviated wells with their true geometry.
See also
For other interpolated, panel-based cross sections, refer to the information about:
Lithology, Stratigraphy, I-Data, T-Data, P-Data, Aquifer, Color, and Fracture sections.
Feature Level: RockWorks Basic and higher
Menu Options
Step-by-Step Instructions
- Rules & Filters
Use the tabs at the top of the window to apply spatial filters, stratigraphic rules, or time/date filters to data being displayed in your logs. (More info)
- 2D Log Design
Click on this tab at the top of the window to set up how you want the logs in the cross section to look.
- Visible Items: Use the check-boxes in the first pane to select which log items are to be displayed. See Visible Item Summary for information about the different log items.
- Options: Click on any of the Visible Items names to see the item's settings in the Options pane to the right. See the Visible Item Summary for links to the Options settings.
- Layout Preview: For each item you've activated, you'll see a preview cartoon in the upper pane. Click and drag any item to the left or right to rearrange the log columns. See Using the 2D Log Designer.
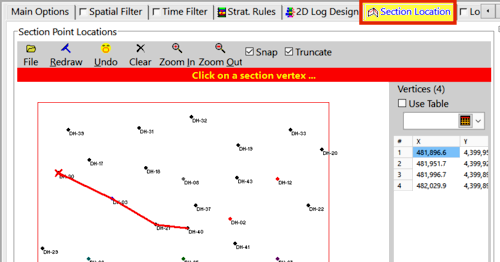
- Section Location
Click on this tab at the top of the window to draw, on a map display of your enabled boreholes, where the cross section panels are to be placed. The most recent section drawn for this project will be displayed. (More info)
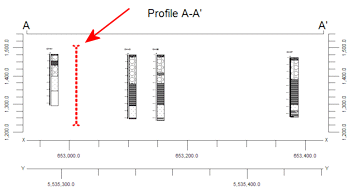
- Location Map
Check this box to create, along with the section, a reference map that shows the section's location. It can be embedded in or created separately from the cross-section.
Click on this tab to establish the map options. (More info.)
-
- Vertical Exaggeration
Click on this tab to pre-define the vertical stretch you would like to apply to your diagram. By giving the program this information in advance of generating the section, it can help with text and graphic sizing and placement. (More info.)
! Note that you can always change the vertical exaggeration at which the diagram is displayed, in the RockPlot2D window itself. But, by telling the program up-front how stretched it will be, you'll get better placement of the graphic components.
- Traverse Defined By...: Use this setting to tell RockWorks how you want to define the cross section location.
- Striplogs
Click the 2D Log Design tab at the top of the window to set up how you want the logs to look. Click on this tab to establish some additional striplog settings.
- Use True Vertical Depth: Check this box if you have deviated holes and want them to be plotted in the section using true vertical depth rather than measured depth.
- Clip: Check this box if you want to display a subset of the log data. Click on the tab to define the elevation range to be displayed.
- Top Elevation: Enter the uppermost elevation to be displayed in the logs.
- Base Elevation: Enter the lowermost elevation to be displayed in the logs.
! Log clipping parameters are defined using elevations, not depths. (More info.)
- Save Log List: Check this to save to a text file the names of the boreholes that are included with the section diagram.
- File in which to store the Log List: Enter the name for the log list text file.
- Display List Upon Completion: Check this to display the text list in Notepad (or equivalent) after the diagram is completed.
- Log Spacing
Click this tab to determine how the logs will be placed in the section.
- Distance between Collar Locations: This setting spaces the logs in the section according to the distance between the boreholes. In this way, close boreholes are plotted close to each other, and distant holes far apart.
- Uniform (Constant) Distance: This option allows you to specify that the logs be evenly spaced across the section. Type in the separation distance in your map units. Why would you select this option? Click here for more info.
- Hang on Datum
Insert a check in this check-box if you want the cross-section to be built with a particular formation set to "0" elevation. All other log data will be plotted relative to that interval.
Click on this tab to establish the settings. (More info)
- Stratigraphic Unit: Click on this item, and the program will display the formations listed in the current Stratigraphy Types Table. Select the formation on which the section is to be hung.
WARNING: Logs can only be hung for boreholes which actually contain the selected unit. It is highly recommended that you disable the holes in which the unit is not present so that you cannot pick them for your section. (See Querying the Database - Stratigraphy Example.)
-
- Annotation
Click on this tab to establish title, border, axis labels, and other perimeter settings for the section. (More info)
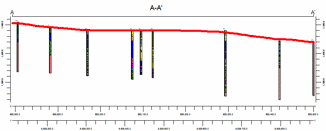
- Surface Profile
Check this box to include a polyline on the section diagram that represents a user-selected elevation grid model, such as the ground surface.
Click on this tab to access the profile options.
- Grid Model: Browse for the name of the existing grid model (.RwGrd file) to be represented in the polyline.
- Polyline Attributes: Click this tab to establish the line settings. (More info.)
- Faults
Check this box if you want to display lines in the output diagram where the section slice intersects the fault(s) defined in a project Faults Tab.
Click on this tab to set up the fault lines. (More info)
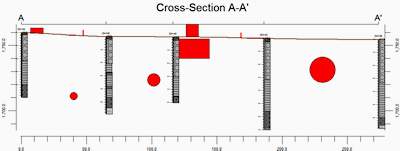
- Infrastructure
Check this box to display buildings, pipes, or other infrastructure with your cross section.
Click on this tab to define the infrastructure file and plot settings. (More info)
- Other 2D Files
Check this option to include existing RockWorks diagrams as layers with your section.
Click on this tab to select the existing .Rw2D files to be included. (More info)
- Peripherals
Check this option to include various peripheral annotations with your cross section. Options include titles, text blocks, legends, and more.
Click on this tab to activate the items and establish their settings. (More info)
- Border
Check this option to include a solid line border around the entire cross section image.
Click on this tab to establish border settings.
- Output Options: Use these settings to define whether the output graphic is to be saved (or displayed as "untitled"), how the file should be named, and whether it is to be displayed after it is created. It also offers export options. (More info)
- Access the Borehole Manager program tab.
- Enter/import your data into the Borehole Manager database as necessary.
- Select the StripLogs | 2D Striplog Section option from the Borehole Operations menu.
- Enter the requested menu options, described above.
- Be sure to click on the 2D Log Design button to establish how you want the logs to look.
- If Traverse Defined By is set to Interactive Map, click on the Section Location button to establish the section location.
- Click on the Continue button to create the striplog section diagram.
The program will create the cross section diagram including the logs of those boreholes you selected. Only the log items you have activated will be displayed in the logs. The diagram will be displayed in a RockPlot2D tab if requested.
- You can adjust any of the settings in the main Options tab to the left, and then click the Continue button again to regenerate the cross section.
! Tip: You can undock the plot window using the  button.
! Tip: Use the Stretch button  in RockPlot2D to fill the window with the section. This is helpful if the section is long and shallow.
- View / save / manipulate / print / export the section diagram in the RockPlot2D window.
 Back to StripLogs Menu Summary

RockWare home page