RockWorks | ModOps | Grid | Filters | Distance Clipping
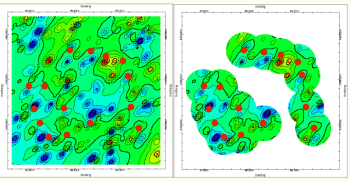
Use this program to filter an existing grid model based on each node's distance from a control point. The replacement value for filtered nodes can be null or any user-defined numeric value. This can be a handy method of blanking out map areas far from control points to indicate low confidence.
! This program requires that the X and Y coordinates for the control points from which the grid model was interpolated are listed in the current RockWorks datasheet.
Feature level: RockWorks Basic and higher
See also
Gridding Options for a distance filter you can apply during grid generation
Menu Options
Step-by-Step Summary
- Rules & Filters
Use the tabs at the top of the window to apply spatial filters, time/date filters, or stratigraphic rules to data being displayed in your map layers. (More info)
- 3D Log Design
If you create a 3D Grid Diagram and decide to include logs, click on this tab at the top of the window to set up how you want the 3D logs to look.
See Visible Item Summary and Using the 3D Log Designer for details.
- Data Columns
- X (Easting): Select the name of the column in the current datasheet that contains the X or Easting coordinates.
These can be Eastings in meters or feet, decimal longitudes, etc. See Defining your Datasheet Coordinates for more information.
- Y (Northing): Select the column that contains the Y or Northing coordinates.
- Input/Output
- Input: Click to the right to browse for the existing RockWorks grid model (.RwGrd file) to be filtered.
- Output: Type in the name to assign to the new grid file that the program will create, which results from the distance filtering operation.
- Options
- Replacement Value: Type in a specific value for the outlying nodes. If you want to use the RockWorks Null value (-1e27), click the Set to Null button.
- Cutoff Distance: Enter the distance from a control point beyond which the grid nodes will be assigned the Replacement Value. You can enter this as a percent of the project size OR in your project units. As you enter either value the other will be updated accordingly.
- 2D Grid Map
Check this box to display the output grid as a 2D map at this time.
Click this tab to set up the 2D map layers (bitmap, symbols, labels, line contours, color-filled contours, labeled cells, map border, etc.).
- 3D Grid Diagram
Check this box to display the output grid as a 3D surface at this time.
Click this tab to set up the 3D map layers (surface colors, images, reference cage, etc.).
! You can request both a 2D and 3D representation of the grid model.
- Click on the RockWorks Datasheet program tab.
- Open the datasheet (.RwDat file) that contains (at minimum) the X and Y coordinates of the control points from which the grid model you're filtering was generated.
- Select the ModOps | Grid | Filters | Distance Clipping menu option.
- Enter the requested menu settings, as described above.
- Click the Continue button to proceed.
RockWorks will load the input grid file and the control point locations. It will determine whether each node lies within the defined distance from a control point or not. Nodes which are outside the distance limit will be assigned the Replacement Value. Nodes inside the limit will pass unchanged. The resulting node values will be stored in a new grid file under the output file name you selected.
The requested diagram(s) will be displayed in a RockPlot2D tab and/or RockPlot3D tab in the Options window.
- You can click on the main Options tab to the left to adjust any of the program settings, and then click the Continue button again to regenerate the model and map.
- View / save / manipulate / export / print the diagram in the RockPlot2D or RockPlot3D window.
 Back to Grid Menu Summary

RockWare home page