RockWorks | ModOps | Grid | Directional | 3D Flow Diagram
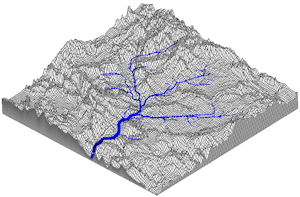
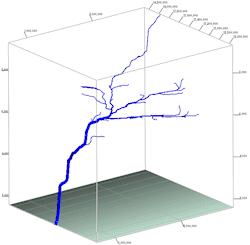
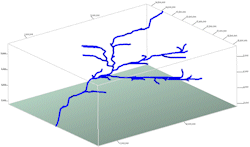
This program creates a simulated three-dimensional drainage net based on an existing surface grid model. This program operates very much like the 2D flow diagrams (we've used 2D images below for some of the illustrations) but uses three-dimensional tubes to depict the predicted drainage. See Importing Grid Files if you need to import an external surface model first.
Menu Options
Step-by-Step Summary
- Input Model
- Input (Surface/Terrain) Grid Model: Click to the right to browse for the name of the existing grid model (.RwGrd) to be displayed as a vector flow map.
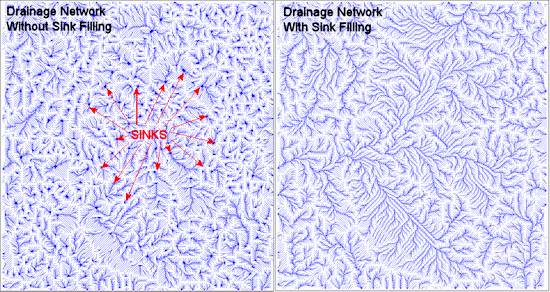
- Fill Sinks: This option will fill any closed depressions such as sinkholes and sampling/gridding artifacts before generating the drainage net. The following example depicts drainage nets for the same grid model with and without enabling the Fill Sinks option.
-
- Flow Parameters
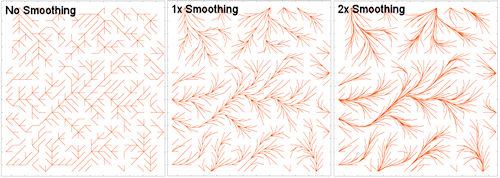
- Smooth Flowlines: If checked, this option will remove the angularity from the drainage net segments. Unfortunately, too much smoothing may result in crossed flowlines.
- Smoothing Passes: A setting of "1" means that the stream segment vertices will be averaged once (i.e. a given vertex is equal to the average of itself, the preceding vertex, and the next vertex). A setting of "2" will average the polyline vertices again, and so on. Typically, a setting of 1 will suffice.
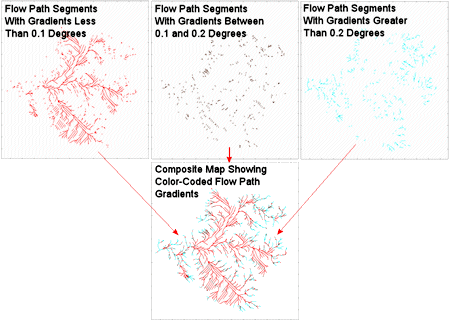
- Gradient Filter: This option is used to filter out stream polyline segments in order to highlight areas in which the stream gradient falls within a user specified range (e.g. very flat versus very steep).
! Note that stream gradients are typically very shallow (e.g. between zero and 0.2 degrees).
- Minimum Gradient: This is the minimum gradient stream segment that will be shown within the drainage net. If you wish to show all low-gradient stream segments (e.g. effectively flat stream segments - ponds and lakes), set the minimum gradient to -1 (negative one). Conversely, if you want to show just areas that may contain rapids, set the minimum gradient to something greater than one degree.
- Maximum Gradient: This is the maximum gradient stream segment that will be shown with the drainage net. If you wish to remove all high-gradient stream segments (e.g. waterfalls, rapids), set the maximum gradient to 2.0.
-
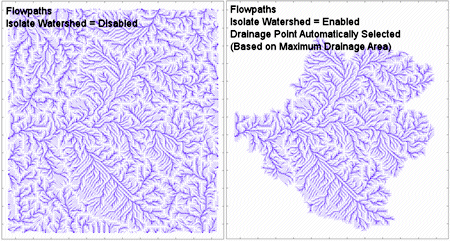
- Minimum Drainage Area Filter: Use this option to hide portions of the flowlines that are negligible, thereby highlighting the major drainages.
The 3D Flow Diagram program generates flowlines for every node within the input grid. Starting at a given node, the program will move downhill until it can't move any farther (e.g. a map edge or a sinkhole). In the process, a record is kept of the number of upgradient nodes that have been traversed in order to reach each node along the flowpath. In this way, it is possible to keep track of the upgradient area that is draining into each point along a flowline. The minimum area filter setting can therefore be used to hide portions of the flowlines that are negligible, thereby highlighting the major drainages.
- Minimum Drainage Area: Use this setting to omit portions of flowlines that drain smaller regions. For example, let's say that; (1) your map units represent meters, (2) you've set the minimum drainage area to "1,000" and (3) area units to "Map Units" (see next item). In such a case, the flowlines would represent only the streams that drain upgradient regions greater than 1,000 square meters.
- Units: This defines the units that are used to specify the minimum drainage area:
- Grid Cells: When set to "Grid Cells", the minimum drainage area simply means that X cells must drain into a given stream vertex in order for that portion of the stream to be visible.
- Project Units: Let's say that your map units represent kilometers. A setting of 100 would correspond to 100 square kilometers.
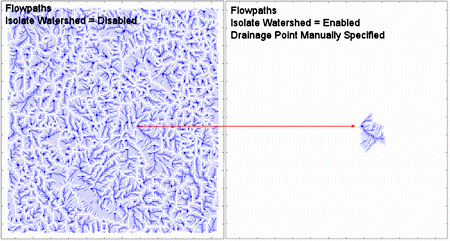
- Isolate Watershed: The following sub-options provide the user with a means for showing a particular watershed (drainage basin).
- Automatic: This option will identify the grid node that has the largest upgradient surface area that drains into that node. This node then serves as the starting point for the drainage net.
-
- Manual: This option allows you to specify the coordinates for a point within the project area. The program will then identify all of the upgradient nodes that drain into that node and draw the corresponding drainage net.
- Filter by Stratigraphy: This option permits you to selectively extract the stream segments that flow through a specified stratigraphic unit.
- Stratigraphic Unit: Clicking on this option will present you with a list of the stratigraphic units that are defined within the Borehole Manager.
- Surface Stratigraphy Grid: Enter the name for a grid model that contains the stratigraphic surface grid. A stratigraphic surface grid is essentially a geologic map (i.e. the nodes are defined by the intersections of the stratigraphic surfaces and the ground surface). These models are typically created by using the Borehole Manager / Stratigraphy / Surface Map program.
- See a detailed example.
- Gradient Sign Convention: Most of the RockWorks programs employ a convention in inclinations below horizontal are negative. This option provides a means to override this convention if so desired.
- Gradients < Horizontal = Negative: Gradients that are below the horizontal (downward pointing segments) will be expressed as negative numbers. Conversely, gradients that are greater than the horizontal (upward pointing segments) will use positive numbers.
- Gradients < Horizontal = Positive: Gradients that are below the horizontal (downward pointing segments) will be expressed as positive numbers. Conversely, gradients that are greater than the horizontal (upward pointing segments) will use negative numbers.
- Flow Tubes
- Tube Color: Choose the color for the 3D tubes to be created to represent the flowpaths.
- Tube Radius:
- Proportional To Drainage Area: This scheme will increase the stream-tube radius based on the number of nodes that drain into that portion of the stream. As a consequence, streams-tubes will become larger in diameter as then progress downstream. The radii are expressed in global coordinates (e.g. if your grid units are expressed in feet, the radii will be plotted in feet). In general, setting the proper minimum and maximum tube radii typically requires some experimentation.
- Minimum Radius: The minimum radius of a stream-tube must be set to a number higher than zero.
- Maximum Radius: There is no limit to the maximum radius.
- Fixed: This setting will render all stream segments at the same radii.
- Radius: The fixed radius is expressed in global coordinates (e.g. if your grid units are expressed in meters, the radii will be plotted in meters). Setting the proper fixed radius requires experimentation.
- Striplogs: Append striplogs to your 3D scene. This assumes you have data entered into the Borehole Manager database (More info)
- Faults: Include 3D fault ribbons with this scene. (More info)
- Drape Image: Include an image in this 3D scene, draped over an existing grid surface. (More info)
- Float Image: Include an image in this 3D scene, floating at a specified elevation. (More info)
- Infrastructure: Display buildings, pipes, or other infrastructure with your 3D scene. (More info)
- Other 3D Files: Include other, existing, RockPlot3D ".Rw3D" files in this scene. (More info)
- Perimeter Cage Include a 3D reference cage around the lithology solid diagram. (More info)
- Legends: Include one or more legends with the diagram.(More info)
- Output Options
- Save Output File: Check this to assign a name for the 3D scene in advance, rather than displaying it as Untitled.
- Automatic: Choose this option to have RockWorks assign the name automatically. It will use the name of the current program plus a numeric suffix, plus the ".Rw3D" file name extension.
- Manual: Choose this option to type in a name of your own for this RockPlot3D file.
- Display Output: Check this option to have the resulting log displayed in RockPlot3D once it is created.
- Be sure you have a RockWorks grid model (.RwGrd file) already created, for input into this program.
- Select the Modops | Grid | Directional | 3D Flow Diagram menu option.
- Enter the requested menu settings, described above.
- Click the Process button to continue.
The program will read the input grid model, compute slope and aspect for each node, and then create a 3D diagram that traces the downward flow paths at the resolution and with the settings you've selected. The map will be displayed in a RockPlot3D tab in the Options window.
- You can adjust any of the settings in the Options window and then click the Process button again to regenerate the diagram.
- View / save / manipulate / export / print the map in the RockPlot3D window.
 Back to Grid Menu Summary

RockWare home page