RockWorks | Borehole Operations | T-Data | Multiple Solids
Use this program to:
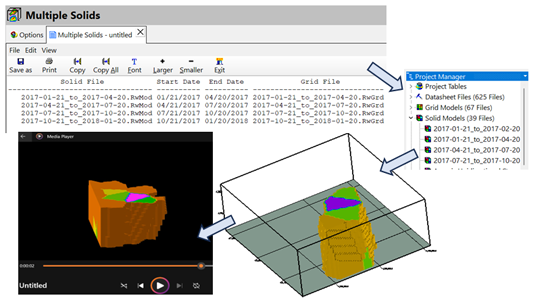
- The Multiple Solids program will create a Datasheet that lists the title, solid name, starting date, ending date, and grid name for each time interval. This Datasheet should be saved as an RwDat file for subsequent use within other RockWorks programs.
- Note: The Multiple Solids program does not produce any maps or diagrams.
- This datasheet is designed to be used by other RockWorks programs that create animations and compute the contaminant volumetrics.
See also
Creating a T-Data Statistics Map for a quick view of high/low/average values.
Feature Level: RockWorks Standard and higher
Menu Options
Step-by-Step Summary
Tips
- Rules & Filters: Use the buttons at the top of the window to apply filters and rules for this program. (More info)
- Spatial Filter: Filter the input data for the T-Data model based on XYZ location, filter the data to be displayed in striplogs, if activated. Note that these tools filter the data that is passed to the modeling and log-generating procedures. This is distinct from the filters that are applied once the model is completed, and described below.
- Input: Click this tab to define the T-Data Track you wish to create solid models and other parameters before running the program; see below for details.
- T-Data Input: Click here to select the data to be modeled and apply additional data filters.
- T-Data Track: Click the prompt to the right to select the name of the T-Data track containing the data to be modeled. This list is pulled from the T-Data Types Table.
- Modeling Interval: Models will be generated by extracting the designated T-Data based on a date range. These dates are computed by adding the designated time period (i.e. 1-day, 1-week, 1-month, 3-months, 6-months, or 1-year).
The amount of time required to create the models is determined by the modeling interval. As a worst-case example, if hundreds of wells were sampled on a daily basis over three years and a Daily Modeling Interval is selected, 1,095 models will be created which may require a very significant amount of processing time (e.g. days) and storage space (e.g. terabytes).
- Duplicate Points: Choose to use all points available or select the type of filtering you prefer.
Starting Date: Determines how the program will handle duplicate points with different g-values that have been obtained within the same sampling interval.
- Ending Date: Determines how the program will handle duplicate points with different g-values that have been obtained within the same sampling interval.
- Solid or Grid Suffix: Type any suffix you want to append to the name of the saved Solid or Grid files. The purpose of the suffix is to allow for unique file names if more than one type of geochemistry is being modeled.
Modeling: Click to the right to select an Algorithm and Special Options for the T-Data model, descriptions will show on the right side to describe each selection.
- Algorithm: Click here to specify the modeling method to use, for creating a solid model from your irregularly-spaced drill hole data. (More info)
- Special Options: Click on this tab to establish other model settings, such as tilting, warping, filtering above-ground, and smoothing. (More info)
If this program is being used to model geochemical changes within groundwater, it is recommended that the solid modeling “Constrain” option be used to confine the geochemical modeling to zones in which groundwater can permeate. This is accomplished by creating a Boolean Permeable/Impermeable (BPI) model and using it as the Constraining Model.
Create Grids: Check this item to create new T-Data Grids for use in the solid modeling.
Type of Conversion (Z = ?): Click here to specify the conversion type you'd like the program to use when it converts each solid to a grid. The most common computation is the Highest G Value. A list with explanations of conversion types is available next to the dropdown menu.
Smoothing: Check on to specify the smoothing method, filter size, iterations, whether to exclude cells based on their Z-value, and check to enable using faults and to smooth null values in the grid.
Click this tab to set up the diagram options.
Output Options:
Use these settings to define how the datasheet is to be saved, how the file should be named, and where to place it after it is created. This menu offers the option to create a RockWorks datasheet file or use other formats; CSV, TXT, and RTF.
Follow these steps to create a 3D solid model of interpolated T-Data values, and/or to create a 3D block diagram illustrating this new model or an existing model:
- Access the RockWorks Borehole Manager program tab.
- Enter/import your data into the Borehole Manager if you have not already done so. This tool specifically reads location, orientation (if any), and T-Data.
- Select the Borehole Operations | T-Data | Multiple Solid menu option.
- Enter the requested program settings, described above.
- Click the Continue button to proceed with file generation.
- You can adjust any of the gridding and/or datasheet settings in the main Options tab, and then click the Continue button again to regenerate the files.
- View / save / manipulate / print / export the datasheet in the Multiple datasheet tab.
- Double-click on the solid model name in the data portion of the RockPlot3D window to access the model settings: transparency, data filters, color scheme, etc.
- Use the File | Append command to append other 3D images such as surfaces.
- Once you have a solid model that appears to represent well the distribution of the T-data values in your project, you can use that existing model (.RwMod) to create other diagram types: profiles, sections, fences, and plan maps, using the other tools in the T-Data menu. You don't need to re-interpolate the background solid model each time.
- Use the Project Manager program tab to create quick 3D views of existing T-data models in your project: just double-click on a .RwMod file name and establish the isosurface/voxel diagram settings.
 Back to T-Data Menu Summary

RockWare home page