RockWorks | Borehole Operations | T-Data | Time-Graph
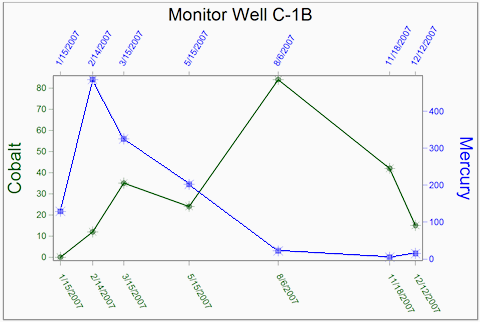
This program is used to plot T-Data as a function of time, for a given borehole.
See also
Time-Graph Map for creating time-charts for multiple boreholes.
Feature Level: RockWorks Standard and higher
Menu Options
Step-by-Step Summary
- Time Filter: Check this item at the top of the program window to process T-Data measurements for a specific date or range of dates. If you leave this un-checked the program will generate the diagram for all of the measurements, for all listed dates.
- Exact: Click in this button if you wish to enter a specific date for the measurements to be processed. Enter into the prompt or choose from the calendar the specific date.
- Range: Click in this button if you prefer to enter a beginning and ending date to define the range of dates to be processed. Type the dates into the Start and End prompts or pick dates from the calendar.
-
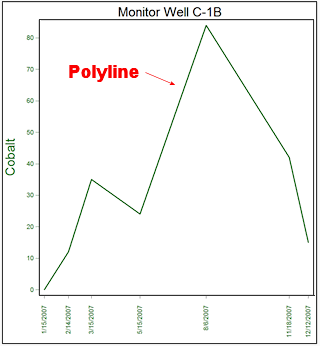
- Tracks
Click on this tab to specify the input data for the diagram.
- Dimensions
Click this tab to access settings for diagram and label sizes and intervals.
- Dimensions
- Diagram: Type in a Width and Height, as a percent of your project size, for the diagram to be output, excluding axis labels, titles, and diagram title. You can make the diagrams virtually any size you choose, as you may scale them up or down during printing from RockPlot.
- Labels: Choose from Small, Medium, Large, or Other. These are defined as a percent of the project dimensions.
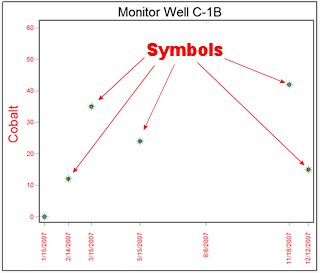
- Symbols: Establish the symbol size as Small, Medium, Large, or Other.
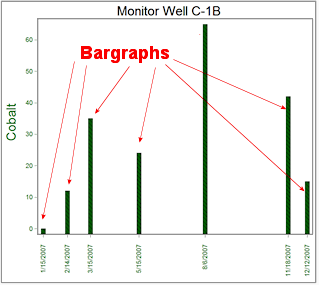
- Bargraphs: Establish the bargraph width as Thin, Medium, Wide, or Other.
- Intervals
- Labeling: Define the intervals at which the horizontal (time) axis is to be labeled. (Default = Samples)
- Tick-Marks: Define the intervals at which the horizontal (time) axis tick-marks are to be placed. (Default = Samples)
- Decimals: Use these settings to define the number of decimal places for the Y-Axis labels.
- Automatic: Choose this option for RockWorks to set the number of decimal places automatically, based on the data range.
- Manual: Choose this option to manually define the number of decimal places in the labels.
- Other 2D Files
Check this option to include existing RockWorks diagrams as layers with your timegraph.
Click on this tab to select the existing diagrams (.Rw2D files) to be included. (More info)
- Peripherals
Check this option to include various peripheral annotations with your diagram. Options include titles, logos, and more.
Click on this tab to activate the items and establish their settings. (More info)
- Border
Check this option to include a solid line border around the entire diagram image.
Click on this tab to specify the line style, thickness, and color.
- Output Options
- Save Output File: Check this to assign a name for the diagram in advance, rather than displaying it as Untitled.
- Automatic: Choose this option to have RockWorks assign the name automatically. It will use the name of the current program plus a numeric suffix, plus the ".Rw2D" file name extension.
- Manual: Choose this option to type in a name of your own for this file.
- Display Output: Check this option to have the resulting diagram displayed in RockPlot2D once it is created.
- Access the RockWorks Borehole Manager program tab.
- Enter/import your data into the Borehole Manager database, if you have not already done so. This program reads T-Data.
- Click on the borehole for which you wish to generate the graph, to make it active.
- Select the Borehole Operations | T-Data | Time-Graph menu option.
- Enter the requested program settings, described above.
- Click the Continue button to proceed.
Once the diagram has been created, it will be displayed in a RockPlot2D tab in the options window, if requested.
- You can adjust any of the modeling or diagram option in the main Options tab to the left and then click the Continue button again to regenerate the Time Graph.
- View / save / manipulate / print / export the image in the RockPlot2D window.
 Back to T-Data Menu Summary

RockWare home page