Plot T-Data Measurements over Time as Google Earth Billboards
RockWorks | Borehole Operations | T-Data | Billboards
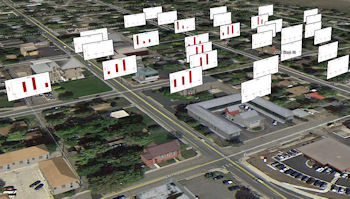
This program is used to plot T-Data as a function of time for all enabled boreholes. The results are then displayed as vertical "billboards" in Google Earth such that the viewer can examine the changes in T-Data spatially.
This program requires that Google Earth is installed on your computer. It is installed separately from RockWorks.
See also
Time-Graph Map for creating time-charts for multiple boreholes in a RockPlot2D map view.
Feature Level: RockWorks Standard and higher
Menu Options
Step-by-Step Summary
- Tracks
Click on this tab to specify the input data for the diagrams.
- Dimensions
Click this tab to access settings for diagram and label sizes and intervals.
- Dimensions
- Diagram: Type in a Width and Height, as a percent of your project size, for the diagrams to be output, excluding axis labels and titles.
- Labels: Choose from Small, Medium, Large, or Other. These are defined as a percent of the project dimensions.
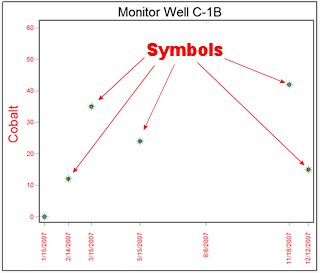
- Symbols: Establish the symbol size as Small, Medium, Large, or Other.
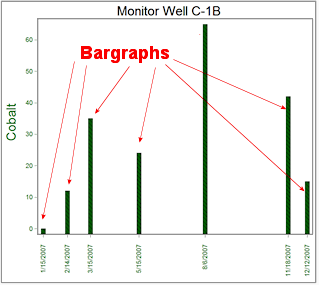
- Bargraphs: Establish the bargraph width as Thin, Medium, Wide, or Other.
- Intervals
- Labeling: Define the intervals at which the horizontal (time) axis is to be labeled. (Default = Samples)
- Tick-Marks: Define the intervals at which the horizontal (time) axis tick-marks are to be placed. (Default = Samples)
- Decimals: Use these settings to define the number of decimal places for the Y-Axis labels.
- Automatic: Choose this option for RockWorks to set the number of decimal places automatically, based on the data range.
- Manual: Choose this option to manually define the number of decimal places in the labels.
- Billboards
Click this tab to view/adjust the Billboard settings.
- Units: Choose Feet or Meters by clicking in the appropriate radio button.
- Width: Type in the width, in the above units, for the billboards. For example, if you set the width to 50 meters, the billboards will plot that wide in relation to the ground in Google Earth.
- Elevation: Enter the offset above ground in the above units.
- Direction: Enter the left-to-right reading direction of the billboards, in a 0 to 360 azimuth format.
- Group clustered wells: Check this box if the billboards for proximal wells are to be combined into a single, stacked diagram.
- Group Name
Click here to enter a name for the map group as it will be displayed in Google Earth.
- Output Options
Click on this tab to define the Google Earth output file and display settings.
- Output File Name
- Automatic: Choose this option to have RockWorks assign the name automatically. It will use the name of the current program plus a numeric suffix, plus the ".KMZ" file name extension.
- Manual: Click this option to type in your own file name. The extension is ".KMZ".
- Display output within Google Earth: Check this box if you want to display the output at this time in Google Earth.
! Note that the actual program which will be used to display the KMZ file is determined by your Windows settings.
- Use Custom View: If unchecked, the starting viewpoint for the map will be determined automatically. If checked you can set a custom view.
-
- Longitude, Latitude: Type in the longitude and latitude coordinates where the viewpoint will be.
- Heading: Type in the 0 to 360 degree bearing from the viewpoint to the map.
- Tilt: Type in the angle downward from the viewpoint to the map.
- Range: Enter the distance in meters from the viewpoint to the map.
- Access the RockWorks Borehole Manager program tab.
- Enter/import your data into the Borehole Manager, if you have not done so already. This tool reads Location and T-Data.
- Enable/disable the boreholes to be included in the billboard displays by inserting/removing the checks from their check-boxes.
- Select the Borehole Operations | T-Data | Billboards menu option.
- Establish the program settings, discussed above.
- Click the Continue button to proceed.
The program will generate the requested graph(s) for the enabled boreholes, storing them in a KML file inside a KMZ (zip) file. The Google Earth KML and KMZ file names will be assigned as you specified.
The billboards will be displayed in Google Earth, if requested.
 Back to T-Data Menu Summary

RockWare home page