RockWorks | Utilities | Survey | 3D
This program is used to process bearing/inclination/distance survey data and display the control points, surveyed points, and traverse lines in a 3D scene.
Feature Level: RockWorks Basic and higher
Menu Options
Step-by-Step Summary
- Rules & Filters
Use the buttons at the top of the window to apply time/date filters or stratigraphic rules to data being displayed in your logs, if activated. (More info)
- 3D Log Design
If you decide to include logs with this diagram ("Striplogs" setting, below), click on this button at the top of the window to set up how you want the 3D logs to look.
See Visible Item Summary and Using the 3D Log Designer for details.
- Data Columns
- Control Points: The first five input prompts establish the columns in the datasheet in which you have listed control point information. For each prompt, select the name of the column in the input survey data file in which the requested information is listed.
- Station #: The station number.
- Station Description: The description for this station.
- Station X: The station's X-coordinate or easting.
These can be Eastings in meters or feet, decimal longitudes, etc. See Defining your Datasheet Coordinates for more information.
- Station Y: The station's Y-coordinate or Northing.
- Station Z: The station's elevation.
Be sure you have defined the units for this column. See Column Setup for more information.
- Survey Data: These prompts establish the columns which list the survey data which reference the known and the calculated stations. Be sure the units for the distance and height (feet or meters) are defined. They can represent different units.
- "From" Station: The station number FROM which the survey measurement was taken.
- "To" Station: The station number TO which the survey measurement was taken.
- Bearing: The compass bearings from the "from" station to the "to" station.
- Inclination: Inclination from the "from" station to the "to" station. (0 degrees represents horizontal, positive degrees is upward and negative degrees is downward.)
- Distance: Distance from the "from" station to the "to" station.
As above, be sure you have defined the units for this and the following linear measurement columns. See Column Setup for more information.
- Instrument Height: Height of measurement instrument. If this is not known, the values in this column can be set to zero.
- Target Height: Height of measurement target. If this is not known, the values in this column can be set to zero.
- Directionality: Choose how the directional data are recorded in the datasheet.
- Declination
- Magnetic Declination Correction: Enter any declinaton correction as described in the program dialog.
- Inclination: Select the format of the inclination measurements you have entered. Choose from:
- Up = 90 Degrees, Horizontal = 0 Degrees, Down = -90 Degrees
- Up = 0 Degrees, Horizontal = 90 Degrees, Down = 180 Degrees
- Diagram Options
- Station Labels: Check this if you want to include labels for the stations in the output diagram. Use the following settings to activate/deactivate and define those labels. For each label type that you activate, you can enter the offsets in 3D space as a percent of your project size (helpful to prevent overplotting). Click the Font button to choose a font style, color, and size.
- Elevations: Check this to include labels representing elevations (program-computed station elevations or the given control point elevations) in the output scene.
- Coordinates: Check this to include coordinate labels, representing the program-computed X,Y coordinates for the stations, or the given X,Y coordinates for the control points.
- Station Numbers: Check this to include labels representing the station numbers taken directly from the datasheet.
- Observations: Check this box to include labels representing the observations taken from the optional description field in the datasheet.
- Traverse Lines: Check this to include bearing, inclination, distance labels along the traverse lines.
- Leader Lines: Insert a check here to include lines between the labels and the points.
- Spheres: Activate this setting to represent the control points and computed X,Y locations with spheres on the 3D diagram.
- Control Point Color: Click the color box to select a color for the spheres plotted at the control point locations.
- Survey Point Color: Select a color for the spheres plotted at the calculated survey point locations.
- Radius: Type in the sphere radius as a percent of the diagram size.
- Traverse Lines: Check this box to include survey traverse lines, plottes as 3D tubes, in the output diagram.
- Color: Select the color for the traverse lines.
- Radius: Type in a radius for the traverse lines as a percent of the project extents.
- Other 3D Diagram Options
Use these checkboxes to append other layers to your 3D scene.
Click each tab to set up the 3D diagram layers (images, infrastructure, reference cage, etc.).
- Output Options: Use these settings to define whether the output scene is to be saved (or displayed as "untitled"), how the file should be named, and whether it is to be displayed after it is created. It also offers export options. (More info)
- Access the RockWorks Datasheet program tab.
- Create a new datasheet and enter or import your survey data.
Or, open one of the sample files and replace that data with your own. See Data Layout for datasheet examples.
! Click the Example button at the top of the window to load a sample file that is installed with the program.
- Select the Utilities | Survey | 3D menu option.
- Enter the requested menu settings, described above.
- Click the Continue button to proceed.
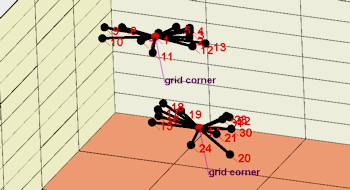
The program will calculate the location of the survey stations and create the 3D scene with the requested items, and display the image in the RockPlot3D tab to the right.
- You can adjust any of the settings in the Options window and then click the Continue button again to regenerate the scene.
- View / save / manipulate / export the scene in the RockPlot3D window.
 Back to Survey Menu Summary

RockWare home page