RockWorks | Utilities | Linears | Rose (From Endpoints)
This program reads line endpoint data and generates a directional diagram that depicts the orientations of the linear features. See also Creating Rose Diagrams from Bearing Measurements.
Menu Options
Step-by-Step Summary
- Data Columns: These prompts tell RockWorks which columns in the current datasheet contain the lineation endpoint data.
Click on an existing name to select a different name from the drop-down list.
- X1, Y1: Select the names of the columns in the data sheet that contain the X and Y coordinates for the beginning points of the lineations.
These can be Eastings in meters or feet, decimal longitudes, etc. See Defining your Datasheet Coordinates for more information.
- X2, Y2: Select the columns that contain the X,Y coordinates for the endpoints of the lines.
- Type of Analysis: These define what the petal length is to represent.
- Frequency: Choose this if petal lengths are to be determined by measurement occurrences.
- Occurrences Per Bin: Choose this if the petals are to represent the number of measurements in each bin.
- Percent of Total Population: Choose this if the petals are to represent the percent of all measurements represented in each bin.
- Length: Choose this option if petal lengths are to be determined by lineation lengths rather than occurrences.
- Cumulative Length of Lineations within Bin: This option sets petal length to the total length of all of the lineations within that bin.
- Length as Percent of Total Lineation Length: This option sets the petal length to the percent of total lineation lengths that are in that bin.
- Diagram Options
Click on this tab to set up the rose diagram appearance.
- Diagram Style: Select either Full for a full, 360-degree rose, or Half for a northern-half rose.
- Length Filters: Establish a minimum-length cutoff and/or maximum-length cutoff for the data to be processed. (More info)
- Azimuth Filters: Activate one or both bearing filters for the data to be processed.(More info)
- Rotate: Rotate all lineations in degrees clockwise from North (0 to 360). (More info)
- Bi-directional: Define your data as uni-directional (unchecked) or bi-directional (checked). (More info)
- Circles: Include concentric reference circles (full rose) or arcs (half rose) that signify percent or total length. (More info)
- Rays: Include reference rays, which extend from the center of the rose outward. (More info)
- Petals: Plot the rose petals and establish their options. (More info)
- Mean Ray: Include the mean vector ray, which represents the mean lineation vector computed from your data set. (More info)
- Mean Error: Include an arc that represents the interval around the vector mean that most likely contains the true population mean direction. (More info)
- Title: Include a title at the top of the diagram. (More info)
- Legend: Include a legend with computed statistics and some diagram settings. (More info)
- Diameter: Establish the maximum diameter and minimum diameter settings. (More info)
- Other 2D Diagram Options
Use these checkboxes to append other layers to your diagram.
Click each tab to set up the 2D diagram layers.
- Other 2D Files: Append other saved Rockplot2D diagrams
- Peripherals: Add a logo, title block, or other peripheral items to your diagram.
- Border: Include a solid-line border around the entire diagram.
- Output Options
- Save Output File: Check this to assign a name for the diagram in advance, rather than displaying it as Untitled.
- Automatic: Choose this option to have RockWorks assign the name automatically. It will use the name of the current program plus a numeric suffix, plus the ".Rw2D" file name extension.
- Manual: Choose this option to type in a name of your own for this file.
- Display Output: Check this option to have the resulting diagram displayed in RockPlot2D once it is created.
- Access the RockWorks Datasheet program tab.
- Create a new datasheet and enter or import your line endpoint data (X1Y1X2Y2).
Or, open one of the sample files and replace that data with your own. See Data Layout for datasheet examples.
! Click the Example button at the top of the window to load a sample file that is installed with the program.
- Select the Utilities | Linears | Rose (From Endpoints) menu option.
- Enter the requested program settings, described above.
- Click the Continue button to proceed.
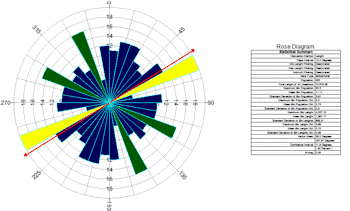
The program will generate a rose diagram that depicts the orientations of the linear features based on the input data and plotting parameters. The diagram will be displayed in a RockPlot2D tab in the Options window.
- You can adjust any of the program options and click the Continue button to regenerate the diagram.
- View / save / manipulate / print / export the diagram in the RockPlot2D window.
 Back to Linears Menu Summary

RockWare home page