Use the programs in the Utilities | Linears menu to read line endpoint or bearing data from the datasheet, generate a variety of different diagrams, and perform computations. This topic summarizes the tools that are available - click on a link or picture for more information.
![]() Back to Utilities Summary
Back to Utilities Summary
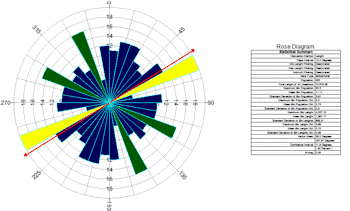
Rose (From Bearings): Read bearing measurements from the datasheet, in a 0 to 360 degree format or a quadrant format, and create a rose diagram that depicts the orientations of the linear features. Petal length reflects frequency of measurements. (More info)
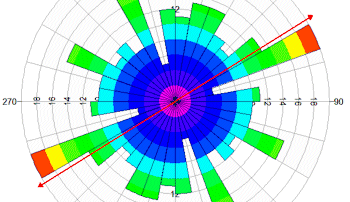
Rose (From Endpoints): Read line endpoint (X1, Y1, X2, Y2) coordinates from the datasheet, and create a rose diagram that depicts the orientations of the linear features. Petal length reflects either frequency or lineation lengths. (More info)
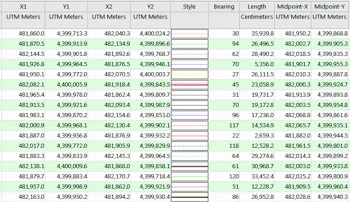
2D Endpoints -> Bearing, Etc: Read line endpoint coordinates from the datasheet, and compute the bearing, length, and/or midpoint of lineations. (More info)
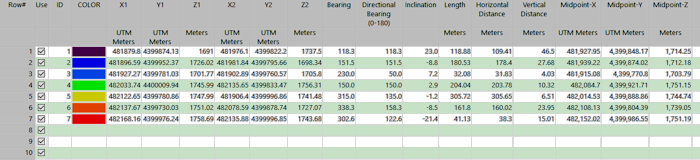
3D Endpoints -> Bearing, Etc: Read line endpoint coordinates from the datasheet, and compute bearing (0 - 360 degrees), directional bearing (0 - 180 degrees), inclination, length, horizontal distance, vertical distance, and midpoints. (More info)
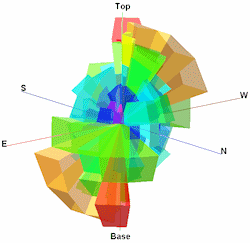
3D Prismgram: Read a listing of azimuth bearings, inclination angles and lengths, and display them as prisms in a single 3D diagram. More info
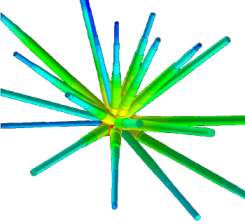
Urchingram: Read a listing of azimuth bearings, inclination angles and lengths, and display them as arrows or tubes in 3D as a single "urchin" shaped object. (More info)
![]() Back to Utilities Summary
Back to Utilities Summary
![]()