RockWorks | Utilities | 3-D | Polylines/Pipelines
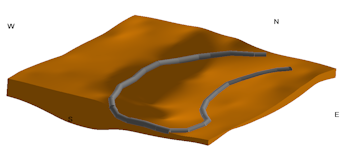
Use this program to read a listing of XY (location) and Z (elevation) points from the RockWorks Datasheet,and create a 3D map with a polyline drawn between these vertices, in a selected color. The 3D polyline is displayed in RockPlot3D, where you can append it to other scenes, as shown above.
See also: Google Earth Polyline Maps for polyline maps output to Google Earth. Or 2D Polyline maps for plan-view (2D) output.
Menu Options
Step-by-Step Summary
- Data Columns: Select the names of the columns in the current datasheet which list the polyline vertices.
- X (Easting): Select the column in which the X coordinates for the polyline vertices.
These can be Eastings in meters or feet, decimal longitudes, etc. See Defining your Datasheet Coordinates for more information.
- Y (Northing): Select the column that contains the Y coordinates for the polyline vertices.
- Z (Elevation): Select the column that contains the Z or elevation values for the polyline vertices.
Be sure you have defined this as a "Linear (Z) column" and the units in the Column Setup pane.
- Polyline Options:
- Title: Enter a title for the polyline. This will be used as the item's label in the RockPlot3D data tree.
- Radius: Enter the radius for the 3D polyline or pipeline. This is defined as a percent of the extents of your project.
- Color: Click the color box to choose a color for the polyline/pipeline.
- Other 3D Diagram Options
Use these checkboxes to append other layers to your 3D scene.
Click each tab to set up the 3D diagram layers (images, infrastructure, reference cage, etc.).
- Output Options
- Save Output File: Check this to assign a name for the 3D scene in advance, rather than displaying it as Untitled.
- Automatic: Choose this option to have RockWorks assign the name automatically. It will use the name of the current program plus a numeric suffix, plus the ".Rw3D" file name extension.
- Manual: Choose this option to type in a name of your own for this RockPlot3D file.
- Display Output: Check this option to have the resulting log displayed in RockPlot3D once it is created.
- Access the RockWorks Datasheet program tab.
- Create a new datasheet and enter or import your X, Y, and Z coordinates into the datasheet
Or, open one of the sample files and replace that data with your own. Here's an example of how the data might look:
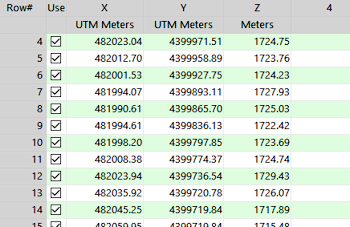
Longitude and latitude coordinates must be in decimal format. If you're using another coordinate system, be sure you've specified the Units and the Projection Settings as appropriate.
- Select the Utilieis | 3-D | Polylines menu option.
- Enter the menu settings as described above.
- Click the Process button to continue.
The program will construct line segments between the coordinate pairs in the current datasheet, using the color and radius you specified. The completed map will be displayed in a RockPlot3D tab in the Options window.
- You can adjust any of the settings in the Options window and then click the Process button again to regenerate the map.
- View / save / manipulate / export / print the map in the RockPlot3D window.
 Back to 3-D Menu Summary

RockWare home page