RockWorks | Utilities | Earth | Oil & Gas Leases
This program:
- Reads a listing of data from the datasheet: Public land survey location descriptions (Range, Township, Section, Location, and Meridians), colors, and dates.
- Creates a KML output file with these leases, using the selected colors and labeling options. You can exclude leases from the map based on a date filter. The polygons will be clamped to the ground.
- Creates a KMZ (zip) output file, containing the KML file.
- Loads the KMZ file in Google Earth.
! This program requires that you have downloaded the RockWorks Landbase. See the Landbase Overview for a discussion and for coverage maps and tables.
Menu Options
Step-by-Step Summary
- Time Filter: Insert a check in this box at the top of the program window if you wish to apply a date filter, plotting only those leases which fall within the desired range. The date column is defined in the Data Columns tab, below. Click this button to enter the date settings. Click the Return to Previous Menu button when you are done entering the filter settings.
- Exact: Choose this option to filter for leases with a specific date. Click in the date prompt to enter the exact date for the leases to be plotted. You can either select from a pop-up calendar, type in a date, or use the up/down arrow keys to modify the existing date value
- Range: Choose this option to filter for a range of dates.
- Start: Click on the date prompt to enter or select the starting date for the leases to be included in the map.
- End: Click on the date prompt to enter or select the ending date for the leases to be included in the map.
-
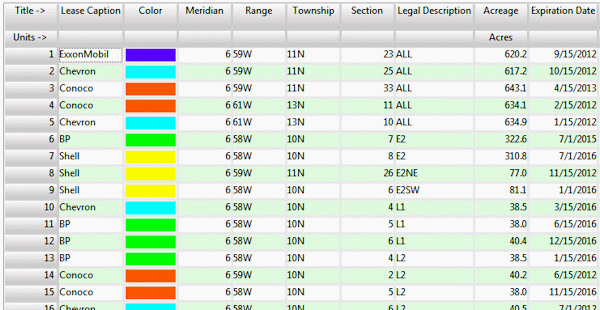
- Data Columns: These prompts tell RockWorks which columns in the current datasheet contain the input data.
Click on an existing name to select a different name from the drop-down list. See a sample data layout below.
- Title: Select the column that contains the name for the lease, which will be plotted as a label in the output map.
- Color: Select the column in the datasheet where the colors are listed.
- Meridian: Select the column that contains the Principal Meridian in which the Township is located. This is required in the event that a project spans more than one Meridian.
- Range: Select the column in the datasheet that contain the Range numbers. These must be entered with the Range number followed by the letter "E" or "e" or "W" or "w", with no spaces separating the number and letter. The number must precede the letter.
- Township: Select the column in the datasheet that contain the Township numbers. These must be entered with the Township number followed by the letter "N" or "n" or "S" or "s", with no spaces separating the number and letter. The number must precede the letter.
- Section: Select the column in the datasheet that contain the section numbers. These must be entered with the Section number (1 - 36) in which the well is located.
- Legal: Select the column in the datasheet that contain the location descriptions. The well locations can be listed in either quarter/quarter format or in footage listings. See the example and link below for details.
- Date: Column that contains the expiration data for the lease. This can be used to display only selected leases via the Time Filter described above.
- Polygon Appearance
- Polygon Titles: Check this box if the Lease titles are to be included as labels in the Google Earth output.
- Polygon Perimeters: Check this to include a line around the edge of the lease blocks. Click the color box to choose the Perimeter color. (The fill color, defined in the input columns, and the perimeter colors may be different.)
- Fill Opacity: Use this setting to define the opacity of the output lease blocks, with 1 = fully transparent and 100 = fully opaque.
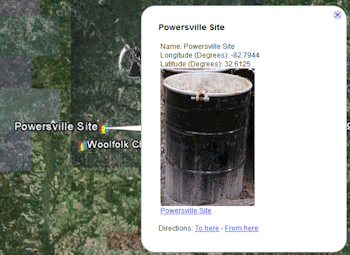
- Hyperlinks: Check this to include additional data with the leases in the output file, which can be displayed in Google Earth by clicking on the lease polygons. Expand this heading to access the options and their data sources. In the example from Google Earth shown here, the extended description popup includes: the Label (first bold line), Descriptions (next three lines), an Image, and a Link (below the image).
- Descriptions: Check this to include extended descriptions. RockWorks pulls the description text from one or more columns in the datasheet. If you use multiple columns, they must be adjacent to each other.
- Description Start Column: Defines the first column containing text for the extended descriptions.
Click on the current name displayed to the right, to choose a different column name from the drop-down list.
- Description End Column: Defines the last column containing text for the descriptions. If you only have one column for description text, set the End Column to the same as the Start Column. All information from the start to the end columns will be included in the descriptions.
- Images: Check this if you want to include images in the description popups.
- Image Column: Defines the column where the image names are listed.
- Links: Check this if you want to include a hyperlink in the description.
- Link Column: Defines the column where the link content is listed.
- Link Caption: Defines the column where the link text (what you actually click on in Google Earth) is listed.
- Group Name: Type in the name to assign to the map, which will be displayed in the Google Earth data tree.
- Output Options: Click on this tab to define the output file and display settings.
- Output File Name
- Automatic: Choose this option to have RockWorks assign the name automatically. It will use the name of the current program plus a numeric suffix, plus the ".KMZ" file name extension.
- Manual: Click this option to type in your own file name. The extension is ".KMZ".
- Display output within Google Earth: Check this box if you want to display the output at this time in Google Earth.
! Note that the actual program which will be used to display the KMZ file is determined by your Windows settings.
- Use Custom View: If unchecked, the starting viewpoint for the map will be determined automatically. If checked you can set a custom view.
- Longitude, Latitude: Type in the longitude and latitude coordinates where the viewpoint will be.
- Heading: Type in the 0 to 360 degree bearing from the viewpoint to the map.
- Tilt: Type in the angle downward from the viewpoint to the map.
- Range: Enter the distance in meters from the viewpoint to the map.
- Access the RockWorks Datasheet program tab.
- Create a new datasheet and enter or import your lease data into the datasheet. (More info.)
Or, open one of the sample files and replace that data with your own.
! Click the Example button to the left to load a sample file that is installed with the program.
Here is an example of how a data file might look. Note that only the X and Y columns (Longitude and Latitude here) are required.
- Select the RockWorks | Utilities | Earth | Oil & Gas Leases menu option.
- Enter the menu options as described above.
- Click the Process button to continue.
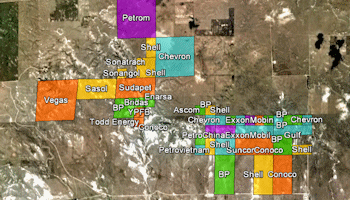
The program will create a KML file containing these lease rectangles, clamped to the ground. It will create a KMZ (zip) file containing the KML file. The Google Earth KML and KMZ file names will be assigned as you specified.
The resulting map will be displayed in Google Earth, if requested.
 Back to Earth Menu Summary
"Google" is a trademark of Google Inc.

RockWare home page