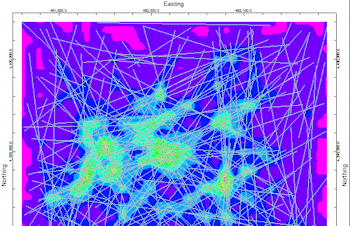
This program is designed to read lineation data from the RockWorks Datasheet (in X1, Y1, X2, Y2 endpoint coordinate format), and create a grid file that models the lineation frequency, cumulative lengths, and/or intersections, with a variety of weighting options. The resulting grid model can be illustrated as a 2D map or 3D surface.
Feature Level: RockWorks Basic and higher
Menu Options
Step-by-Step Summary
Tip: Include the lineation map layer with this grid map using the Map Overlays | Lineations layer.
! Click the Example button at the top of the window to load a sample file that is installed with the program.
The program will read the measurements from the data sheet. It will create the requested lineation grid model(s), weighting and combining them if multiple models were selected, storing the resulting numeric grid file on disk if you so requested. If you have requested a diagram, it will be created and displayed on the screen.
![]() Back to Grid Menu Summary
Back to Grid Menu Summary
![]()