RockWorks | Graphics | Images | Vertical | Single Curved
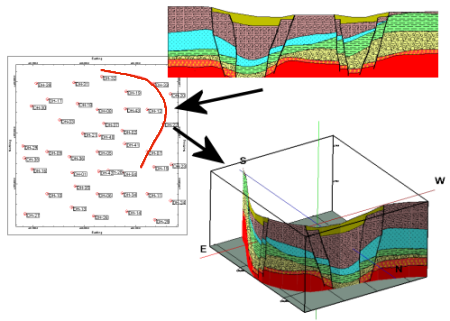
Use this program to display a single image as a curved vertical panel in 3D, along the X and Y polyline coordinates which are defined in the RockWorks datasheet.
! The X and Y coordinates for the curved polyline are assumed to be in the first two columns in the datasheet.
Feature Level: RockWorks Basic and higher.
Menu Options
Step-by-Step Summary
- Rules & Filters
Use the tabs at the top of the window to apply spatial filters, time/date filters, or stratigraphic rules to data being displayed in your 3D logs, if activated. (More info)
- 3D Log Design
If you decide to include logs with this diagram ("Striplogs" setting, below), click on this tab at the top of the window to set up how you want the 3D logs to look.
See Visible Item Summary and Using the 3D Log Designer for details.
- Options
- Group Title: Enter here the name for the RockPlot3D group into which the image "pieces" will be listed. (As RockWorks projects the input image along the curved polyline, it will be broken into sections.)
- Raster Image File Name: Type in or browse for the name of the raster image file to be projected onto the polyline.
- Top Elevation: Type in the elevation for the top of the image. This should represent the output project units.
- Base Elevation: Type in the elevation for the base of the image.
- Set Transparent Color: Check this item if you want to specify a specific color in the bitmap images to be displayed transparent. Click the color box to choose that color.
For example if the image has a white background and you would like that part to be see-through, you would select white.
- Other 3D Diagram Options
Use these checkboxes to append other layers to your 3D scene.
Click each tab to set up the 3D diagram layers (striplogs, reference cage, infrastructure, etc.).
- Output Options: Use these settings to define whether the output scene is to be saved (or displayed as "untitled"), how the file should be named, and whether it is to be displayed after it is created. It also offers export options. (More info)
- Access the RockWorks Datasheet program tab.
- Create a new datasheet and enter or import the X and Y coordinates for the polyline along which the image will be projected in 3D. The X coordinates must be in the first column, and the Y coordinates in the second. Be sure you have set up the columns types and units.
Or, open one of the sample files and replace that data with your own. See Data Layout for datasheet examples.
! Click the Example button at the top of the window to load a sample file that is installed with the program.
- Select the Graphics | Images | Vertical | Single Curved menu option.
- Enter the settings as described above.
- Click the Continue button to proceed.
RockWorks will read the indicated raster image, project it into 3D space along the defined polyline and using the specified elevations. If requested, it will display it as a curved, vertical panel in a RockPlot3D tab in the Options window.
- You can adjust any of the options along the left (such as transparent color) and click the Continue button to regenerate the 3D scene.
- View / save / manipulate / print / export the image in the RockPlot3D window.
 Back to Image Menu Summary

RockWare home page