RockWorks | Borehole Operations | Fractures | Rose Map
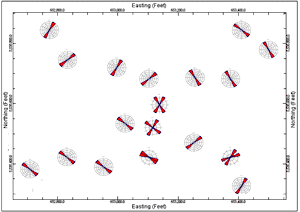
This program reads fracture data for all enabled boreholes and generates a directional diagram for each hole that depicts the orientations of the features. The individual diagrams are then displayed at the borehole locations on a plan-view map.
See also
Creating Individual Rose Diagrams from Fracture Data
Feature Level: RockWorks Standard and higher
Menu Options
Step-by-Step Summary
- Rules & Filters: Use the buttons at the top of the window to apply filters and rules for this program. (More info)
- Spatial Filter: Filter the input data for the map based on XYZ location.
- Time Filter: Filter any T-Data or Aquifer data in borehole location map labels, if activated.
-
- Diagram Options
Click on this tab to set up the rose diagram appearance.
- Diagram Style: Select either Full for a full, 360-degree rose, or Half for a northern-half rose.
- Type of Analysis: These define what the petal length is to represent.
- Occurrences Per Bin: Choose this if the petals are to represent the number of measurements in each bin.
- Percent of Total Population: Choose this if the petals are to represent the percent of all measurements represented in each bin.
- Azimuth Filters: Activate one or both bearing filters for the data to be processed.(More info)
- Rotate: Rotate all measurements in degrees clockwise from North (0 to 360). (More info)
- Bi-directional: Define your data as uni-directional (unchecked) or bi-directional (checked). (More info)
- Circles: Include concentric reference circles (full rose) or arcs (half rose) that signify percent or total length. (More info)
- Rays: Include reference rays, which extend from the center of the rose outward. (More info)
- Petals: Plot the rose petals and establish their options. (More info)
- Mean Ray: Include the mean vector ray, which represents the mean vector computed from your data set. (More info)
- Mean Error: Include an arc that represents the interval around the vector mean that most likely contains the true population mean direction. (More info)
- Title: Include a title at the top of the diagram. (More info)
- Legend: Include a legend with computed statistics and some diagram settings. (More info)
- Diameter: Establish the maximum diameter and minimum diameter settings. (More info)
- Rose Dimensions
Use these settings to define the width and height of the roses, as a percent of the project size. (Default = 10)
- Add 2D Map Options
Use these checkboxes to append other layers to your map.
Click each tab to set up the 2D map layers (background image, map peripherals, map border, etc.).
- Output Options
Use these settings to define whether the output map is to be displayed after it is created and how/whether it is to be saved in a file in the project folder. (More info)
- Access the RockWorks Borehole Manager program tab.
- Enter/import your fracture data if you have not already done so.
- Enable the boreholes whose fracture data are to be represented in the map.
- Select the Borehole Operations | Fractures | Rose Map menu option.
- Enter the requested program settings, described above.
- Click the Continue button to proceed.
For each borehole, the program will generate a rose diagram that depicts the orientations of the fracture bearings. It will build a map of these rose diagrams, placing the rose center at the borehole location. The completed map will be displayed in a RockPlot2D tab in the Options window, if requested.
- You can adjust any of the program settings in the main Options tab to the left and click the Continue button to regenerate the map.
- View / save / manipulate / print / export the map in the RockPlot2D window.
 Back to Fracture Menu Summary

RockWare home page