RockWorks | Borehole Manager | Fractures | Rose Diagram
This program reads fracture data for all enabled boreholes and generates a directional diagram that depicts the orientations of the features.
See also
Create Rose Diagram Maps
Feature Level: RockWorks Standard and higher
Menu Options
Step-by-Step Summary
- Diagram Options
Click on this tab to set up the rose diagram appearance.
- Diagram Style: Select either Full for a full, 360-degree rose, or Half for a northern-half rose.
- Type of Analysis: These define what the petal length is to represent.
- Occurrences Per Bin: Choose this if the petals are to represent the number of measurements in each bin.
- Percent of Total Population: Choose this if the petals are to represent the percent of all measurements represented in each bin.
- Azimuth Filters: Activate one or both bearing filters for the data to be processed.(More info)
- Rotate: Rotate all measurements in degrees clockwise from North (0 to 360). (More info)
- Bi-directional: Define your data as uni-directional (unchecked) or bi-directional (checked). (More info)
- Circles: Include concentric reference circles (full rose) or arcs (half rose) that signify percent or total length. (More info)
- Rays: Include reference rays, which extend from the center of the rose outward. (More info)
- Petals: Plot the rose petals and establish their options. (More info)
- Mean Ray: Include the mean vector ray, which represents the mean vector computed from your data set. (More info)
- Mean Error: Include an arc that represents the interval around the vector mean that most likely contains the true population mean direction. (More info)
- Title: Include a title at the top of the diagram. (More info)
- Legend: Include a legend with computed statistics and some diagram settings. (More info)
- Diameter: Establish the maximum diameter and minimum diameter settings. (More info)
- Other 2D Diagram Options
Use these checkboxes to append other layers to your diagram.
Click each tab to set up the 2D diagram layers.
- Other 2D Files: Append other saved Rockplot2D diagrams
- Peripherals: Add a logo, title block, or other peripheral items to your diagram.
- Border: Include a solid-line border around the entire diagram.
- Output Options: Use these settings to define whether the output graphic is to be displayed after it is created and how/whether it is to be saved in a file in the project folder. (More info)
- Access the RockWorks Borehole Manager program tab.
- Enter/import your fracture data if you have not done so already.
- Enable the boreholes whose data are to be included in the diagram.
- Select the Borehole Operations | Fractures | Rose Diagram menu option.
- Enter the requested program settings, described above.
- Click the Continue button to proceed.
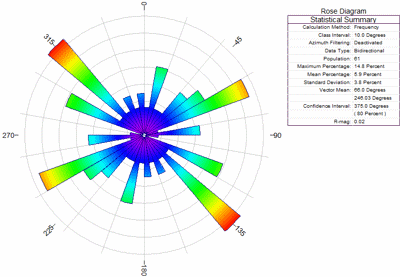
The program will generate a rose diagram that depicts the orientations of the fracture bearings based on the input data and plotting parameters. The diagram will be displayed in a RockPlot2D tab in the Options window, if requested.
- You can adjust any of the program settings in the Options tab to the left and click the Continue button to regenerate the diagram.
- View / save / manipulate / print / export the diagram in the RockPlot2D window.
 Back to Fracture Menu Summary

RockWare home page