RockWorks | Utilities | HydroChem | Durov Diagram
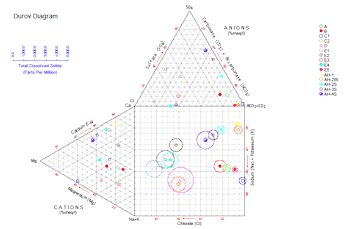
This program reads concentration data from the RockWorks datasheet and builds a Durov diagrams, which demonstrate the relationship between various ions within hydrochemical samples. Total Dissolved Solids (TDS) values are depicted with proportionally scaled circles, similar to those in the Piper Diagram program. Contours are also available for TDS data and relative sample density.
Concentrations entered in the source data file in units of milligrams per liter are converted to milli-equivalents per liter for display on the diagram. (See Conversion Factors.)
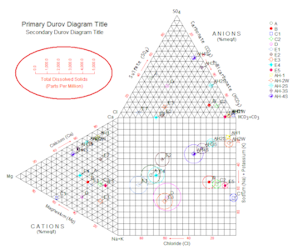
The Durov Diagram is an alternative to the Piper Diagram. In the two triangles, it plots the major ions as percentages of milliequivalents. The totals of both the cations and anions are set to 100% and the data points in the two triangles are projected onto a square grid which lies perpendicular to the third axis in each triangle.
Menu Options
Step-by-Step Summary
- Input Columns: These prompts tell RockWorks which columns in the current datasheet contain the input data.
Click on an existing name to select a different name from the drop-down list.
- Sample ID: If you have sample numbers listed for your sites, choose the column where these are listed.
- Symbol: Choose the column that lists specific symbols for the individual samples.
- Na, K, Ca, Mg: Choose the columns that list these required cations. The measurements must be listed in ppm or mg/l units.
- Cl, HCO3, CO3, SO4: Choose the columns that list these required anions. The measurements must be listed in ppm or mg/l units.
- Additional Cations
- Cation A, B, C, D: Use these checkboxes to turn on up to 4 additional (non-standard) cations to be included in the Durov Diagram's TDS (total dissolved solids) computations, if activated. Click in each check-box to turn an ion on or off.
- Data Column: For each cation that you activate, select the name of the column in the current datasheet where the data is listed.
- Conversion Factor: For each cation that you activate, you also need to declare a conversion factor to convert from ppm or mg/l to milli-equivalents. See Conversion Factors for help.
! This is important - RockWorks will not know this conversion factor automatically. You need to enter it manually.
- Additional Anions
- Anion A, B, C, D: Use these checkboxes to turn on up to 4 additional anions to be included in the Durov Diagram's TDS (total dissolved solids) computations, if activated. Click in each check-box to turn an ion on or off.
- Data Column: For each anion that you activate, select the name of the column in the current datasheet where the data is listed.
- Conversion Factor: For each anion that you activate, declare a conversion factor to convert from ppm or mg/l to milli-equivalents. See Conversion Factors for help.
! As above, this is important - RockWorks will not know this conversion factor automatically. You need to enter it manually.
- Titles: Click on this tab to specify text, if any, for the main and secondary diagram titles. You may enter up to 60 characters for each title. Click the color box to the right to select their color.
- Diagram Options
- Border: Insert a check-mark here if you want the diagram border to be plotted. Click the graphic to the right to choose the style and color.
- TDS Circles: TDS (Total Dissolved Solids) circles are plotted as rings around each point in the square portion of the Durov diagram, and represent the combined total of all of the cations and anions in parts per million (or mg/l) for that sample (standard and any additional ions).
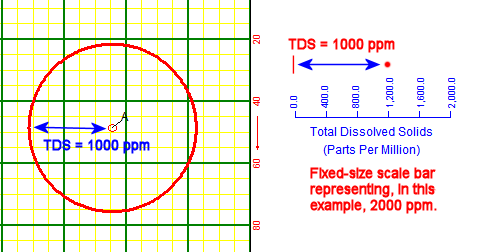
- Scalar: If activated, you need to determine the scale at which the TDS circles will be plotted, using this setting. The number entered in this prompt will represent the number of ppm (or mg/l) units represented by the fixed-size Scale Bar which can be plotted to the left of the diagram, and the radius of the TDS circles.
Here's an example for which the total dissolved solids for this single sample is 1,000 ppm. The scalar is set to 2,000. The radius of the circle is half the length of the fixed-size scale bar.
-
- Symbol Index: If activated, a small index listing sample ID's and their symbols will be included to the right of the Durov diagram. If your samples have unique symbols, this is a handy way to identify samples without having to include labels in the diagram itself.
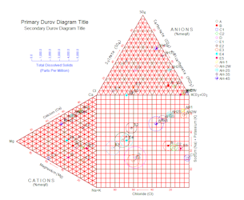
- Major Dividers, Minor Dividers: Insert a check in either/both of these items to create a reference background grid for both the triangular plots and the square plot. Use the radio buttons to select their spacing (in percent) and line style and color. The percentage interval you select for the Major Dividers will also determine the axis labeling interval. Major dividers are outlined in the first image in the left, and the Minor Dividers are outlined in red in the second image.
-
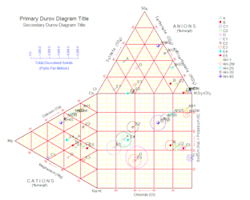
- Ternary Titles: Insert a check here to label the Cations and Anions axes. An example Ternary title is circled in red directly below:
-
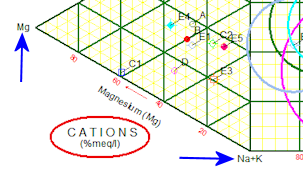
- Vertex Labels: Check this to label the constituents for the vertices of the plot. Some sample Vertex Labels are pointed next to blue arrows above.
- Axis Titles: Check this to label the axes with the ions that they represent. You cannot change the text for these labels. Click the color box to select the title color.
- Axis Labels: Check this item to label the axis with the percentage intervals selected for the Major Dividers, above. Click the color box to select the label color.
- TDS Scalebar: If activated, the Total Dissolved Solids scalebar will be included with the diagram, at the scale declared under the TDS Scaler, above. Select the scale bar color.
-
- Point Symbols: Check this to have the symbols listed in the main datasheet plotted for each sample in the Durov diagram, using the color also listed in the datasheet. Enter the Size declared as percent of diagram width (default = 4.0) and line thickness in pixels.
- Point Labels: If activated, the sample's Point Symbols will be labeled with the sample ID. Like the symbols, above, you may click on the Size item to establish label size, in percent of diagram width. You can also choose label color.
- Contours Represent... If you turn on the Contours layer, described below, use these settings to define what data is to be contoured.
- Sample Density: Check this option to contour the number of occurrences of samples.
- TDS: Check this option to contour the Z value which represents the total number of dissolved solids.
- Grid Density: Select the density of the grid used for contouring. (Default = 20)
- Contours
Check this box if you want to include contours on the diagram, representing sample density or TDS as defined above.
Click on this tab to establish the contour settings.
- Colored Intervals
Check this option to plot solid color-filled regions representing the distribution of values in the map or diagram
Click on this tab to establish the color-contour settings. (More info)
- Contour Lines
Check this option to plot lines representing the distribution of values in the map or diagram.
Click on this tab to establish the line-contour settings. (More info)
- Labeled Cells
Check this option to display a grid of lines corresponding to the grid nodes, and fills the cells with labels for the node value. Click on this tab to establish the labeled-cell settings. (More info)
- Gradient Vectors
Check this option to display small arrows between grid nodes to represent uphill or downhill gradients.
Click on this tab to establish the gradient-vector settings. (More info)
- Other 2D Diagram Options
Use these checkboxes to append other layers to your diagram.
Click each tab to set up the 2D diagram layers.
- Other 2D Files: Append other saved Rockplot2D diagrams
- Peripherals: Add a logo, title block, or other peripheral items to your diagram.
- Output Options
- Save Output File: Check this to assign a name for the map in advance, rather than displaying it as Untitled.
- Automatic: Choose this option to have RockWorks assign the name automatically. It will use the name of the current program plus a numeric suffix, plus the ".Rw2D" file name extension.
- Manual: Choose this option to type in a name of your own for this file.
- Display Output: Check this option to have the resulting map displayed in RockPlot2D once it is created.
- Access the RockWorks Datasheet program tab.
- Create a new datasheet and enter/import your hydrochemistry data into the datasheet.
Or, open one of the sample files and replace that data with your own. See Data Layout for datasheet examples.
! Click the Example button at the top of the window to load a sample file that is installed with the program.
- Select the Utilities | HydroChem | Durov Diagram menu option.
- Enter the requested program settings, described above.
- Click the Continue button to proceed.
The program will read the ion concentration information from the datasheet, convert the ppm or mg/l measurements to milli-equivalents per liter based on the conversion factors, normalize the measurements to plot the anions and cations in the trilinear plots, and project the samples over to the square plot. If total dissolved solids circles were requested, they will be computed and drawn around the sample points in the main diagram. Sample density or TDS will be gridding and contoured if requested.
- You can adjust any of the diagram options along the left and click the Continue button to regenerate the plot.
- View / save / manipulate / print / export the diagram in the RockPlot2D window.
 Back to Hydrochemistry Menu Summary

RockWare home page