Use the programs in the Utilities | HydroChem menu to read ion concentration data from the datasheet, generate a variety of different diagrams, and perform a variety of computations. This topic summarizes the tools that are available - click on a link or picture for more information.
![]() Back to Utilities Summary
Back to Utilities Summary
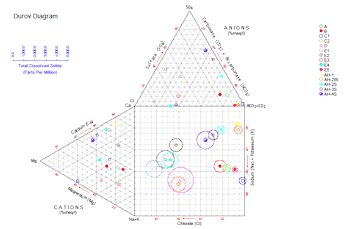
Durov Diagram: Read ion concentrations from the datasheet, and create a Durov diagram, with symbols and grid lines, and optional TDS circles, TDS contours, and point density contours. (More info)
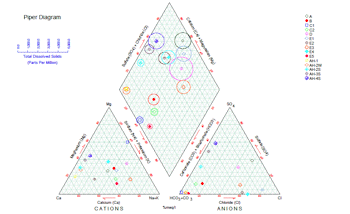
Piper Diagram: Read ion concentrations from the datasheet, and create a Piper diagram, with symbols, grid lines, and optional TDS circles. (More.)
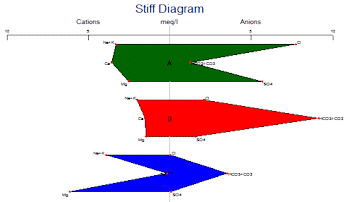
Stiff Diagram: Read ion concentrations from the datasheet, and create a Stiff diagram for each sample. You can group any number of polygons onto each diagram "page." (More.)
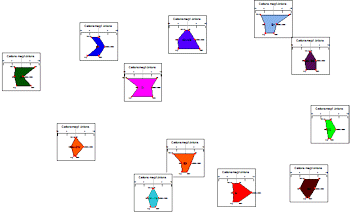
Stiff Diagram Map: Read XY locations and ion concentrations from the datasheet, and create a Stiff diagram for each sample. The polygons will be displayed at the sample locations a map view. (More.)
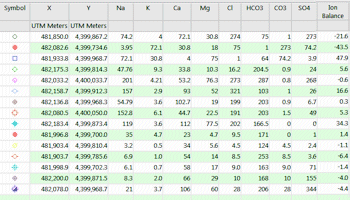
Ion Balance Calculations: Read a listing of ion concentrations from the datasheet and compute cation:anion ratio for each sample, in milli-equivalents per liter. The computations are stored in a column in the datasheet. (More.)
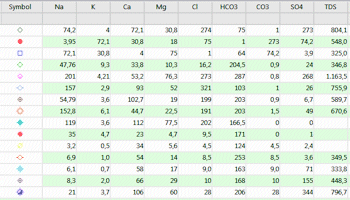
Total Dissolved Solids Calculations (TDS): Read a listing of ion concentrations from the datasheet and compute the total dissolved solids for each sample. The computations are stored in a column in the datasheet. (More.)
![]() Back to Utilities Summary
Back to Utilities Summary
![]()