RockWorks | ModOps | Solid | Extract Grids | Solid -> Grade Thickness Grid
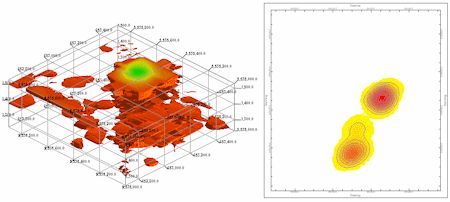
Given a solid model that contains grade values (e.g. percent eU308) this program will produce a GT (grade-thickness) grid and contour map in which the contours represent the grade multiplied by the thickness. In other words, high valued areas may represent either thick zones of lower-grade ore or thin zones of high-grade ore.
Here's how the program works: For each column of voxels within the initial grade model, the "sum" of voxel GT values is computed and saved as the GT value within the grid model. These voxel GT values are computed by multiplying the grade value by the voxel height. If a voxel grade value is less than the user-specified cutoff (minimum acceptable grade value) the voxel will not be included in the summation. If the final sum is below the user-specified cutoff (minimum acceptable grade-thickness), the program will set the corresponding grid value to zero.
! This program requires that a solid model containing grade values already exists (Solid | Model, I-Data | Model, etc.)
Feature Level: RockWorks Basic and higher
Menu Options
Step-by-Step Summary
- Filters
Use these tabs at the top of the window to apply spatial or time/date filters to data being displayed in your map layers. (More info)
- Input/Output
- RockWorks Solid Model File (Input): Browse for the solid model (.RwMod file) that contains the Grade values to be processed.
- RockWorks Grid Model File (Output): Click to the right to type in the name to assign to the output grid model (.RwGrd file), which will represent Grade * Thickness.
- Grade Range
- Minimum Acceptable Grade Value: Type in the minimum grade value of interest in the input model.
- Minimum Acceptable Grade-Thickness: Type in the minimum acceptable grade-thickness value.
- Create 2-Dimensional Grid Diagram: Insert a check here to create a 2D map of the output grid model. Click on this tab to set up the 2D map layers (bitmap, symbols, labels, line contours, color-filled contours, labeled cells, etc.).
! Don't request map symbols or labels if you don't have any data loaded into the Utilities datasheet at this time.
- Output Options: Use these settings to define whether the output graphic is to be saved (or displayed as "untitled"), how the file should be named, and whether it is to be displayed after it is created. It also offers export options. (More info)
- 3D Grid Diagram: Insert a check here to create a 3-dimensional image of the output grid model. Click on this tab to set up the 3D map layers (surface style, colors, perimeter, reference cage, etc.).
! Since the grade * thickness values may be quite large, you may find it best to display your 3D surface as flat.
- Output Options: Use these settings to define whether the output scene is to be saved (or displayed as "untitled"), how the file should be named, and whether it is to be displayed after it is created. It also offers export options. (More info)
- Select the ModOps | Solid | Extract Grids | Grade -> Grade Thickness (GT) menu option.
- Enter the requested menu item, described above.
- Click the Continue button to proceed.
RockWorks will read the input solid model and determine those voxels whose Grade values fall below the minimum threshold, discarding them. The remaining voxel grade values will be multiplied by the voxel height, to represent Grade * Thickness (GT). The program will scan each vertical column of voxels, adding up the GT values. For each column, if the total exceeds the minimum GT threshold you've defined, that GT total will be assigned to the corresponding grid node in the output model. If the total GT value for the column is less than the threshold, the corresponding grid node will be assigned a value of 0.
The requested diagram(s) will be displayed in a RockPlot2D tab and/or RockPlot3D tab in the Options window.
- You can adjust any of the settings via the main Options tab to the left, and then click the Continue button again to regenerate the diagram(s).
- View / save / manipulate / export / print the diagram(s) in the RockPlot2D or RockPlot3D windows.
 Back to Solid Menu Summary

RockWare home page