This section of the Borehole Manager tutorial contains lessons for creating diagrams to illustrate interpreted stratigraphic units listed in the project Stratigraphy data tables.
If you have already done the lithology lessons, many of these procedures will be very much the same. The images will look different, however, because they represent stratigraphic layers rather than observed lithologies.
Pick a lesson by clicking on its arrow. We recommend going through these lessons in the order listed.
![]() If this is the first lesson set you’ve done, please be sure you have already (1) opened a project folder, (2) restored the program defaults, and (3) set the output dimensions.
If this is the first lesson set you’ve done, please be sure you have already (1) opened a project folder, (2) restored the program defaults, and (3) set the output dimensions.
| Tutorial Lesson | Minimum licensing level |
|
| Display stratigraphy logs in 3D. This offers a quick, overall view of the stratigraphy data as entered, across the project. |
Basic (or Trial) |
|
| Display stratigraphy logs in a 2D cross section. This shows the stratigraphy data for selected boreholes in a multi-log cross section diagram, with straight-line correlation panels. |
Basic (or Trial) |
|
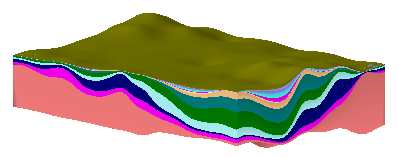
| Create a 3D stratigraphic model. Here you will create surface models for the top and base of each formation and display them as a stratigraphic model in 3D. |
Standard (or Trial) |
|
| Create a modeled stratigraphic cross section. Using the surfaces interpolated above, we'll create an interpolated cross section. |
Standard (or Trial) |
|
| Create a 2D stratigraphic structure map. Create a plan-view contour map of a formation's elevations. |
Standard (or Trial) |
|
| Run a stratigraphy volume report. Compute the volume of each layer in the stratigraphic solid model. |
Standard (or Trial) |
See also: Lithology versus Stratigraphy
![]() Back to main menu
Back to main menu
![]()