 Estimated time: 8 minutes.
In this lesson, you will be creating an image representing the stratigraphy data in multiple logs in the Samples project, selected along a multi-log cross section trace. Straight-line (not model-based) correlation panels will be included.
! For log-only cross sections, with no interpolation panels, you would use the Striplogs | 2D Striplog Section menu.
- Click on the Stratigraphy menu in the upper menu ribbon, and then click on Section | Linear Correlations.
- Establish the section options: These are found in the Main Options tab of the Stratigraphy Section window.
- Now let's move to the top of the window to adjust the filters, log settings, and section location settings.
 Spatial Filtering: off
- Time Filter: off
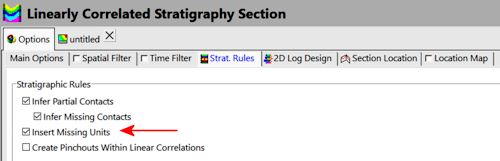
- Strat Rules: Click on this tab.
 Infer Partial Units: Be sure this is checked. This tells RockWorks to try to determine a missing top or base depth for a formation based on overlying or underlying strata which are defined.
- Infer Missing Contacts: Be sure this also is checked. This sub-option can plot the contacts for partial units midway between the available top and base.
- Insert Missing Units: For this pass, leave this option unchecked. We'll return to it in a moment.
- Create Pinchouts within Linear Correlations: Leave this option off, also.
- 2D Log Design: Click on this tab where you will establish the striplog options.
-
The program will display the 2D log designer window. This window has three main sections:
- The left pane is where you choose what type of data is to be displayed in the logs (the visible items).
- The upper-right pane is where you see a Preview of the active log items. You can drag the items to adjust their relative placement.
- The lower-right pane displays specific Options for the Visible Item that you click on.
a. Choose the items you want to see in the logs by inserting a check-mark in the following items in the left pane:
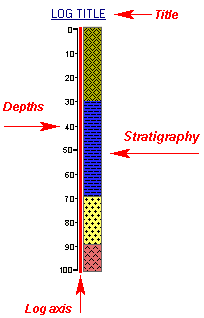
- Title: The drill hole name will plot above the logs.
- Depths: The logs will be labeled with depth tick marks and labels.
- Stratigraphy: The logs will contain a column illustrating formations with graphic patterns and colors.
- None of the other options, including Text, should be checked.
b. Adjust the arrangement of the visible log items: You should see four items in the upper Preview pane: title, depth bar, log axis, and stratigraphy patterns.
- Practice clicking on an item, holding down the mouse button, and dragging it to the left or right in the preview.
- Try getting the items aligned in the following order:
! Note that the log axis is always activated, it acts as the anchor point for the log. The axis will be placed at the actual log location in the diagrams. The log title is always placed atop the axis.
c. Check the options for each visible item by clicking on the item's name in the listing; its options will be displayed in the Options pane.
- Click on the Stratigraphy item.
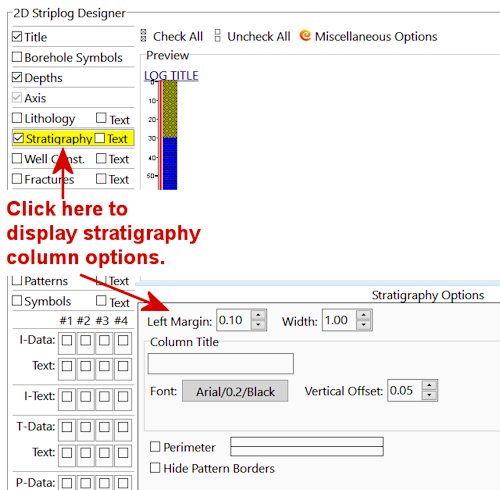
- Column Title: Delete any text displayed in this prompt.
- Width: This setting, above the Title, sets the width of the stratigraphy column. Set this to 1.
! All log item sizes are expressed as a percent of the dimensions of the project, so the width of these logs will be about 1% of the project dimensions.
- Location Map: Find this tab to the right of the 2D Log Design tab. Check this item. This will create a small map that shows the location of the section in the study area. Click on this tab to change:
- Output Options: Click this tab at the bottom of the window.
 Append Map to Diagram: Click in this radio button. Be sure the Size setting is set to Medium.
- Section Location: Next, pick the boreholes to display. Click on the Section Location tab, to the left of the Location Map.
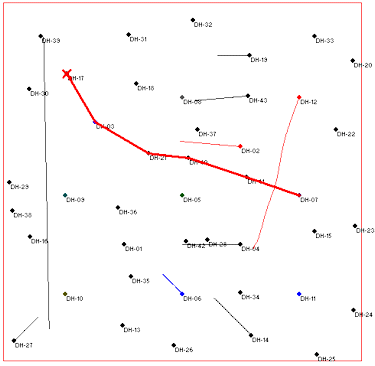
- If you don't see the section trace pictured below, follow these steps; otherwise skip to step 4 below.
- Click on the Clear button at the top of the panel-picking window. The program remembers your cross section traces from session to session; this will clear any old traces from memory.
- Next, locate the hole titled DH-17 (toward the upper-left) and click on it. It will be marked with a red X.
- Locate hole DH-03 southeast of 17 and click on it. A line will be drawn between the holes.
- Locate hole DH-21 southeast of 03 and click on it.
! If you make a mistake, click the Undo button to undo the last pick or the Clear button to clear the map for starting over.
- Click on DH-40, DH-41, and DH-07 continuing the cross section southeastwardly through the project area.
- You should see a trace like this:
- Faulting: Click this tab to set up your Faulting Options in your striplog display and to modify fault options. (Read this for more details.)
- Continue: Click the Continue button at the bottom of the Stratigraphy Section window when you are ready to create the section plot.
RockWorks will:
- create strip logs of each of the selected borings using the selected settings. The logs will be spaced proportionally to their distance from each other on the ground.
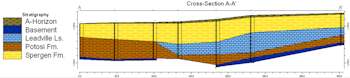
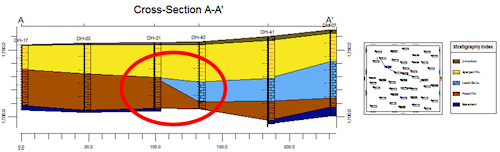
- draw straight-line correlations between like horizons in adjacent holes and fill them with the background color specified for the formation in the Stratigraphy Types table.
- create a map that displays the location of the section slice within the study area and append it to the cross section.
The completed log section will be displayed in a RockPlot2D tab in the Options window. RockPlot2D is where 2-dimensional maps, sections, and other diagrams are presented.
- Note that there is a hole in the middle of the section, where no correlation has occurred for the Leadville Limestone (light blue) in DH-21.
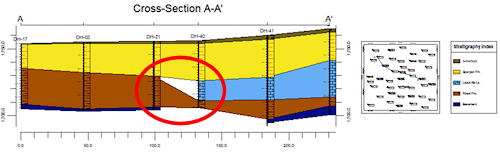
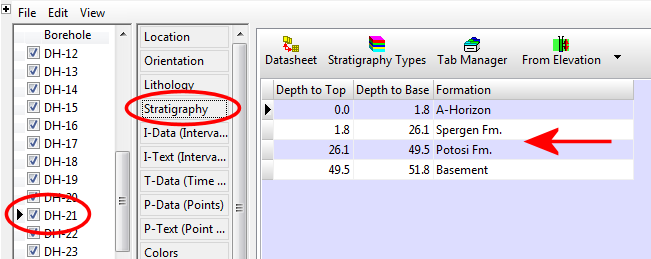
If you move this window out of the way and click back into the Borehole Manager, click on DH-21, and click on the Stratigraphy button, note that the Leadville Ls. is missing from this hole.
- Return to the cross section window, and click back on the Options tab in the upper-left corner of the window to return to the menu settings. Click on the Strat Rules tab. Now:
- Insert Missing Units: Insert a check in this option. With this turned on, the program will assume that formations which are missing entirely at a contact can be pinched out at that location. The program will insert them into proper sequence, with zero thickness, during the creation of the diagram. Note that this rule does not affect the data in the database, but instead adds the extra control when the data is processed for diagram generation.
- Click the Continue button again to regenerate the diagram.
Now RockWorks has filled in the missing panel.
- Adjust the Vertical Exaggeration: The VE notation, in the upper toolbar, is still shown at 1, meaning that the section's length (horizontal) and elevations (vertical) are being plotted at the same scale. In your own work, you may find that your distance and depth units aren’t so agreeable, and you’ll need to apply some stretch to your images to get a good look.
- You can use either the Stretch button
 to fill the screen at whatever scales, or
- You can adjust the vertical stretch specifically by clicking on the VE button (or choosing View | Vertical Exaggeration) and typing in a desired value.
- Reposition the Stratigraphy Legend: In RockPlot2D you have the ability to edit the entities in the plot window.
- Click on the Edit arrow in the upper-left corner.

- Click on the stratigraphy legend, on the right side of the diagram. When it is selected, you'll see handles on each corner.
- Click on the legend and drag it to another location in the window. Release the mouse button when it is positioned to your liking.
- To resize the legend, click and hold one of the corner handles and drag so that it is smaller or larger.
- If you like, you can double-click on the legend to see the options available in the Legend Attributes window. There are settings that control the legend size, position, and appearance. Click OK to close the Attributes window.
- Save this image for later work in the ReportWorks program, where you can create a nice layout of the log profile and the section location map. Choose File | Save, and type in the name: Straight Strat Section and click Save. The program will save this image in its own .Rw2D file format.
- Click on the other Untitled plot tab, where the first cross section was displayed. Close that tab, by clicking in the Close button (X) which is displayed on the tab. You do not need to save the changes to this diagram.
- Minimize the entire window for the time being, by clicking on the
 button in the upper-right corner.
- If you’d like to do the ReportWorks lesson at this time, click here.
- Otherwise, continue on with the stratigraphy model lesson, below.
See also: RockPlot2D tutorial, Hole to Hole Sections versus Profile Sections
 Displaying Multiple Logs in a 2D Hole to Hole Section
 Back to Stratigraphy menu | Next (3D Stratigraphic Model)

RockWare home page