In this lesson, you will get a quick view of all of the stratigraphy data as entered for the project's boreholes. You will look at how the data is entered, and you will generate a 3D diagram representing the borehole stratigraphy logs.
- Be sure the Samples folder is still the current project folder (see Open a Project for information).
- In the borehole file listing along the left side of the Borehole Manager, click on the borehole named DH-04 to make it active.

- Click on the Stratigraphy tab to load the stratigraphic data for this hole.
! Note how the stratigraphic units are noted with a top and bottom depth, and a formation name. Missing data can be left blank (as in the Leadville Ls base depth above) and there are a set of "rules" which can help fill in the blanks. You can enter your formations or layers using regular words like "limestone" or "Leadville Ls." In order to know formation order, and the colors and patterns to be used to represent them, the program relies on a reference library called a Stratigraphy Types Table. This is created by the user. A Stratigraphy Types Table is created for each project that has stratigraphy information. We’ll look at this in a minute.
- Click on the borehole DH-03 in the list to the left, and you’ll see the information listed in its Stratigraphy table.
Note how the formations must be consistent in order between boreholes. The formations CANNOT repeat within a single borehole. ("Lithology" by contrast does not show organized layering. See the lessons on lithology diagrams for more information.)
If formations are missing from a particular borehole, you can either omit them altogether, or enter them with the same top and base as the formations above and below (and thus have zero thickness). The latter method allows for better pinching out of surfaces. See Missing Formations for more details.
- Look at the project's Stratigraphy Types Table:
- Click on the Strata Types button that sits above the stratigraphy data listings.

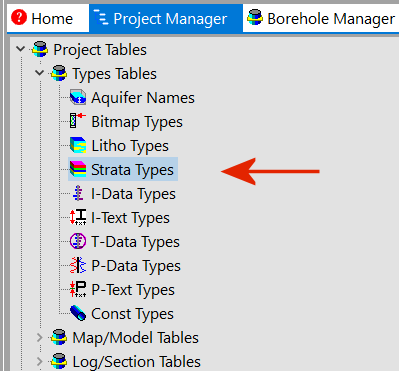
You can also access the Strata Types table using the Project Manager program tab, in the Project Tables | Types Tables grouping.
- View the Stratigraphy Types table.
A quick summary:
- Order: Defines the order in which the formations are listed in the data tables, the order in which the stratigraphy layers are modeled, and the actual numeric values that will be assigned to the formations should you create a stratigraphic solid model. Numbering starts with upper formations and increases downward.
! This is important. In your own work, be sure the formation order is defined correctly. To edit a value, just click in the cell and type in a new number.
- Formation: The formation names in this project.
- Pattern: The specific pattern in specific colors for the formation.
- Fill Percent: Defines how much of the available space the pattern block should occupy in strip logs (less than 100% can show erosion, weathering).
- Density: The rock density - used only for computing mass.
- Show in Legend: Used to specify whether the unit's name is to be included in the diagram legends. Un-checking an item doesn't remove it from the table itself, just from any subsequent legends that are created.
! This setting can also be used to limit the stratigraphic modeling to checked formations - helpful in your own work if you have a deep project with many stratigraphic units.
- To add a row to the listing, just click in the lowest existing row and press the down-arrow key on your keyboard.
- To delete a row from the listing, click in the row and type Ctrl+Del.

- Click on the OK button to close the Stratigraphy Types Table.
- To create the 3D logs, locate the Striplogs menu in the upper menu ribbon, Borehole Operations section, and select the Striplogs | 3D Striplogs menu option.
This window has several sections:
- The Main Options tab displays the general diagram settings along the left side of the window.
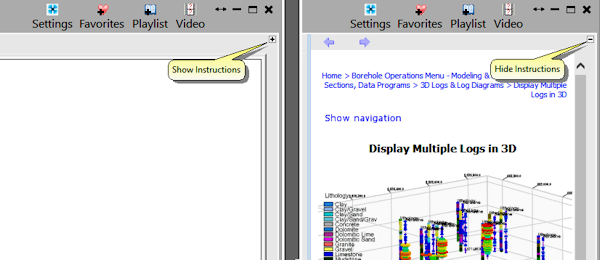
- The Instructions pane to the right displays reference information about the settings. You'll find this in most of the RockWorks program windows. Use the small + or - button in the top-right to turn the instructions on and off.
-
- Along the top of the window, next to the Main Options tab, you'll see some filter and rules tabs.
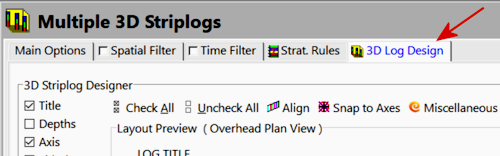
- The 3D Log Design tab at the top is where you establish the log-specific settings. In this window:
- The left pane is where you choose what type of data are to be displayed in the logs (the visible items).
- The upper-right pane is where you see a plan-view Preview of the active log items. You can drag the items to adjust their relative placement.
- The lower-right pane displays specific Options for the log items that you click on.
- Click on the Main Options tab to establish the general diagram settings along the left.
 XYZ Clipping: Uncheck this.
- Draped Image, Floating Image: Be sure these are not checked.
- Perimeter Cage: Uncheck this.
- Legend(s): Turn this off. We will add a legend interactively in RockPlot3D.
- Infrastructure -> Other 3D Files: Be sure these are not checked.
- Output Options: Click on this tab.
 Display: Be sure this is checked, so that the 3d scene will be displayed on completion.
- Save: Check this item. This permits us to assign a name to the output file in advanced. (If you leave this unchecked, which is default, the diagram will simply be displayed as "untitled".). Click this tab to adjust the settings.
- Manual: Click on this item. This tells RockWorks you want to assign a specific name for the scene. (The other option is automatic naming, whereby the program will assign the name automatically.)
- RockPlot3D Output File: Click in the prompt and type: Stratigraphy Logs
- Export: Be sure this is not checked.
- Click on the 3D Log Design tab at the top of the window.
- Choose the items you want to see in the logs by inserting a check-mark in the following items in the left pane of the window:
- Faulting: Click this tab to set up your Faulting Options in your striplog display and to modify fault options. (Read this for more details.)
- Click the Continue button at the bottom Options window to proceed.
RockWorks will create a strip log for each borehole, including well name and stratigraphy column, and it will build a labeled reference cage around the logs. The entire diagram will be displayed in a new RockPlot3D display tab.
! Each time you click the Continue button, the 3D display will be regenerated.
The instructions below will take you on a quick tour of RockPlot3D. This lesson will cover different items than were highlighted in the lithology tutorial.
As you can see, the image is displayed in the pane to the right, and the image components and the standard reference items are listed in the pane to the left, called the data tree.
- Adjust the background color for the display, by clicking the color button in the toolbar above the image display and making a selection. The program will remember the background color you select from session to session.

- Adjust the reference items in the upper portion of the window's data pane.
- World Outline: Uncheck this - since there’s a reference grid in this image, the world outline is redundant.
- Axes: Turn this item off.
- Practice rotating the image. The default viewing operation is rotate (see the button depressed in the toolbar
 ). Left-click and hold anywhere in the log display and drag slowly to the left or right, up or down and see how the display rotates. Release the mouse button when you are done. Rotate the image again if you wish.
- Set the view to a fixed viewpoint by clicking on the View | Above option. From the pop-up list, select North-East. Since the wells will appear lined up, rotate the image slightly to the left.
- Add a stratigraphy legend so that you know what the different log intervals represent. (Remember that you can add the legend automatically during the generation of the logs themselves. This lesson just shows how to do so in RockPlot3D after the logs are created.)
- Select the Edit | Add Legend |Stratigraphy option from the RockPlot3D menu. You’ll see a legend inserted to the left of the image, and a new Stratigraphy legend item listed in the data tree to the left (Legends heading).
- Click on the large Font button near the bottom of the window and set the font size to 12, and click OK to close the font window.
- Click the Apply button at the bottom of the Legend Options window to have the change applied to the view.
- Legend location: Finally, you can play with putting the legend on the Left Side or the Right Side of the image, clicking Apply any time you want a setting change applied.
- You can adjust the Zoom percent of the log diagram using the drop-down at the top of the window. You can also use your mouse's scroll wheel.

- Click the Close button when you are ready to close the Legend Options window.
- Now, let's create a saved viewpoint.
- Use the Rotate, Pan, and Zoom tools to adjust the scene to a viewpoint that you like.
- Save this viewpoint by selecting the View | Add View menu option.
- In the View Name window, type in a name that will be recognizable, such as "Northwest Zoomed In" and click OK.
- This can be saved with the 3D scene; to re-display your scene from the saved viewpoint, just double-click on its name under the Views heading in the Data tree. You can save as many Views as you like.
- Save the changes: Click on the File menu - the menu bar is above the viewing pane - and choose the Save option. Since you assigned a name already to this 3D scene, the program will simply save the changes you have made to the file.
- Close the RockPlot3D window by clicking in the Close button (X).
