 Estimated time: 5 minutes.
In this lesson, you will create a 3D model of the project's stratigraphic surfaces.
Unlike a 3D lithology model (see that lesson) which uses a solid model to represent material types, the stratigraphic model represents multiple surface models, stacked on top of each other. The surfaces are interpolated from the stratigraphy contacts defined in the boreholes, using a process referred to as "gridding." (More.)
! You must be using RockWorks in Trial mode, or have a Standard or Advanced license to run this modeling program.
- Back at the main program window, with the Samples boreholes still displayed, click on the Stratigraphy menu and select the Layered Model option.
- Stratigraphy Units: Click on this tab and choose All Stratigraphic Units. (The other option offers a means of limiting the modeling to activated unts in the Types Table - handy for deep projects.)
 Interpolate Surfaces: Be sure this is checked. This tells the program to interpolate surfaces for the units rather than use existing surfaces (e.g. from a previous run of this program). Click on this tab to access the gridding options.
- Gridding Method
- Dimensions
 Based on Output Dimensions: This should be the default setting. The surfaces will be dimensioned as per the settings under the Output Dimensions, and also displayed here.
! In your own work, we recommend you choose this option so that the grid and solid model dimensions are consistent. However, the program does offer the option to vary the model dimensions, under the Variable Dimensions heading. Confirm Dimensions: Uncheck this (though in your own work, this is a handy way to double-check the model extents and node spacing).
- Algorithm: These options determine the method that will be used to interpolate the surface models.
- Triangulation: Choose this option for the modeling method.
- Interpolate Edge Nodes Using Inverse-Distance: Be sure this is checked.
! Note that if you choose a different gridding method, the options that are visible will change.
- Options: Click this tab to establish these gridding options.
- Decluster: On
- Logarithmic: Off
- High Fidelity: Off
- Polyenhance: Off
- Densify: Off
- Maximum Distance: Off
- Z = Color: Off
- Smoothing: On (Default size and Iterations = 1)
- Modeling Sequence: Click this tab to define whether upper or lower units are to have priority.
 Base-to-Top (Onlap): Choose this option. This assures that the model will be built from lower formations upward, such that upper layers cannot fall below or interfere with lower layers.
- Constraining Surface: Off (This allows you to filter the uppermost unit using a ground surface model.)
- Polygon Filter: Off
- Baseplate: Uncheck this.
- Volumetrics: On.
- Save as Solid Model: On. This tells the program to build a solid model file behind the scenes, representing the stacked stratigraphic surfaces. This solid won't be used at this time, but we'll use it a bit later for volume computation.
- Output File: Click to the right and type in: Stratigraphy.RwMod
More on stratigraphic models.
- Diagram: Click on this tab to access the stratigraphy diagram settings.
- Explode: Uncheck this. (It's used to insert space between the units when displayed in 3D.)
- Hide Thin Zones: Uncheck this.
- Other diagram layers
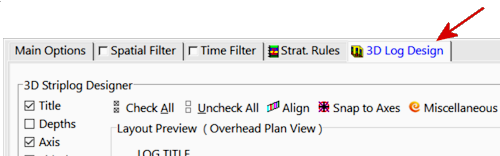
- Striplogs: Yes. Be sure that none of the clipping options are turned on. The defaults for the appearance of the logs should still be remembered from the first lesson. Feel free to click on the 3D Log Design tab at the top of the window to double-check the 3D log setup.
- Draped Image, Floating Image, Perimeter Cage: Be sure these are not checked.
- Legend(s): Check this item, and click on the tab.
- Stratigraphy: Check this option to include a legend to the stratigraphy types with the diagram.
- Title: Enter: Stratigraphy
- Position: Choose Right
- Infrastructure or Other 3D Files: Be sure these are not checked.
- Output Options: Click on this tab.
- Display: Be sure this is checked, so that the 3d scene will be displayed on completion.
- Save: You can leave this unchecked. We will save the file once it is generated and displayed.
- Export: Be sure this is not checked.
- Faulting: Click this tab to set up your Faulting Options in your striplog display and to modify fault options. (Read this for more details.)
- Click the Continue button at the bottom of the window.
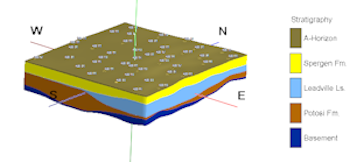
RockWorks will create a grid model of each stratigraphic surface and base. The grid models will be stacked and displayed with side panels in a new RockPlot3D tab.
(Since you activated the Save Model option, above, the program will also initialize a blank solid model and insert the grid surfaces into the solid model. This means that the model nodes between each formation’s base and surface will be coded with the numeric "G" value listed in the Stratigraphy Type Table. The resulting stratigraphic solid model will be stored on disk under the name "stratigraphy.RwMod." This model will be set aside for later use.)
- Some things to note:
- As before, the 3D image is displayed in the pane to the right, and the image components and the standard reference items are listed in the pane to the left. (You can reverse the position of the image and data panes using the << and >> buttons above the "linked file list.")
- RockWorks imbeds the individual grid files (representing the surfaces) within the xml file so won't be shown as linked files
- The program created a copy of your stratigraphy types, and stored these in the view in the Tables section of the data listing. The stratigraphy legend is linked to this information.
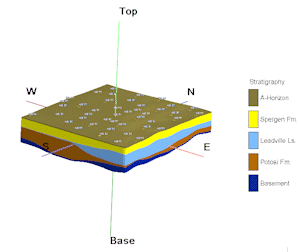
- Adjust the vertical exaggeration: Click on the Dimensions button
 and set the Vertical Exaggeration to 1.5. Click Apply, and then Close.
- Expand the Stratigraphy Model group
 in the data tree. Note the formation names are listed there.
- Expand the upper formation, A-Horizon, group. Note the total volume listed for the formation. In addition, total mass will be listed, which is the result of the volume multiplied by the Density Factor listed for that formation in the Stratigraphy Types Table. It's important to note that in your own work, you should be sure that the Density Factor you enter is correct before taking stock in the displayed mass computations.
- Remove the check-mark from the next formation, Spergen Fm, and see how that entire formation will be removed from the image view. Remove the check-mark from the next formation, Leadville Fm, as well, and it will disappear.
- Expand the next formation, Potosi Fm, in the data tree, and expand its Top group. Double-click on the formation top’s Elevation Grid to open the RockPlot3D Grid Options window.
- Click in the Color Scheme drop-down list, and choose the Continuous option. Click Apply to see how the upper surface of the formation is now displayed in color.
- Click Close to close the Grid Options window.
- Save this image by choosing File | Save As. Enter the name: Strat Model and click the Save button. The file Strat Model.Rw3D will be stored in your project folder.
- Other things to try:
- Double-click on the Stratigraphy Model group icon - the parent of all of the formation groups - and set the Opacity setting for the whole image to 70 and click Apply.
- Change the font size or style in the stratigraphy legend by expanding the Legends heading, double-clicking on the Stratigraphy legend item, clicking on the Font button, and selecting a different font size or style.
 Stratigraphy Models, Gridding Reference

RockWare home page