 Estimated time: 3 minutes.
In this lesson, you will use the stratigraphic surface models created in the previous lesson, and create a multi-panel cross section. This will be similar to the cross section you created previously in this lesson set, except that the correlation panels are based on the interpolated grid models rather than straight-line correlations.
! The instructions below are written with the assumption that you have completed the Cross Section lesson and the Stratigraphy Model lesson.
- Click on the Stratigraphy menu and choose Section | Model-Based.
- Vertical Exaggeration: This should be set to 1.
- Stratigraphic Units: This should still be set to All Stratigraphic Units.
 Interpolate Surfaces: Uncheck this box since you already modeled the surfaces in the previous lesson.
! This is really important - if you have a good stratigraphic model created, you don't need to keep reinterpolating the surfaces just to create a new type of diagram to display, using those same surfaces.
- Fill Style: Expand this heading.
 Fill Background: Check this box. The panels will include the background colors defined for the units in the Stratigraphy Type Table.
- Plot Patterns: Unchecked. By displaying only colors on the panels themselves, this makes it easier for the patterns in the striplogs to stand out.
- Plot Outlines: Unchecked.
- Other settings: These should still be default from previous lessons.
- Striplogs: Yes. (The current 2D Striplog Designer settings should be fine, from previous lessons.)
- Annotation: Yes.
- Surface Profile: Unchecked.
- Infrastructure: Unchecked.
- Other 2D Files: Unchecked.
- Peripherals: This should still be checked, with the Stratigraphy Pattern Key selected.
- Border: Unchecked
- Output Options
- Display: Checked.
- Save: Unchecked.
- Export: Unchecked.
- 2D Log Design: This tab, at the top of the window, should still be set up to display stratigraphy logs from the earlier lesson.
- Section Location tab: We'll use the same section trace from the previous lesson.
- Location Map: Checked. This should still be set up from the previous lesson.
- Faulting: Click this tab to set up your Faulting Options in your striplog display and to modify fault options. (Read this for more details.)
- Click the Continue button at the bottom of the window when you are ready to proceed.
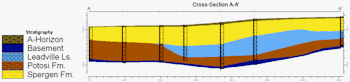
RockWorks will read the existing surface models and extract panels along the indicated cross-section trace. It will build them into a continuous cross section diagram, with the indicated perimeter annotation. The stratigraphy logs will be appended to the section diagram. The completed diagram will be displayed in a new RockPlot2D tab.
- Bring up the previously-saved straight section by hovering over the RockWorks icon on the Windows taskbar, and clicking on the Linearly Correlated Stratigraphy Section window.
- Arrange the windows so that you can compare their appearance. Click the small Zoom Out
 tool to rescale the diagram within the window space.
The benefits of modeled sections are that they look smoother and better represent the stratigraphic data near as well as along the section cut. Straight sections are helpful by displaying the data as entered. They can highlight data errors as well as formation discontinuities.
We often create straight sections first to determine boreholes where data should be checked and missing formations dealt with – whether they are left blank or are entered with a thickness of zero will have different effects. You can refer to the missing formations topic in the Help messages for details (link below).
- Save the modeled section using the File| Save As menu command. Type in the name: Strat Mod Section and click Save.
 Creating Interpolated Stratigraphic Sections, Missing Formations

RockWare home page