 Estimated time: 8 minutes.
Let's move from profile-type views to plan-views of the stratigraphic units. First we’ll create a 2D contour map of the surface of one of the stratigraphic units. In the process of building the contour map, the program will create a grid model of the surface elevations, just like the ones created for the stratigraphic model in a previous lesson.
! You must be using RockWorks in Trial mode, or have a Standard or Advanced license to run this modeling program.
- Click on the Stratigraphy menu in the upper menu ribbon, and select Structure Grid.
- Horizon: Click this tab.
- Stratigraphic Unit: Click the down-arrow to display the formation names in the project. Click on the item Leadville Ls.
 Superface (Top): Click in this button to specify the model is to represent the top of the formation.
- Establish gridding settings:
- Output Grid: Click this tab to type in the following name for the surface’s grid model: Leadville
- Gridding Method: Click this tab if you want to review the gridding settings used in the previous lessons. We'll use the same settings here.
 2D Grid Map: Check this option to generate the 2D map. Click on this tab to choose the map layers.
- Other map layers
- Output Options
- Display: Checked.
 Save: Unchecked.
- Export: Unchecked.
- 3D Grid Map: Uncheck this option.
- Click the Continue button to proceed.
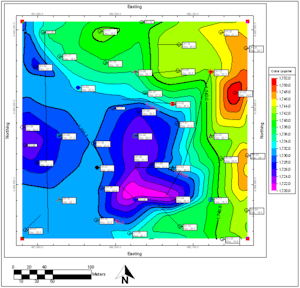
RockWorks will read the well location and downhole survey information from the Borehole Manager tabs to determine the known location and elevation points on the surface of the Leadville Ls unit. It will use these known points to then create a grid model of the entire surface using the Triangulation gridding method, and will store the model under the file Leadville.RwGrd. It will then create a color-filled contour map overlaid with line contours to represent these elevations. Map symbols and labels will be plotted. The borders of the map will be annotated with coordinate labels, and a color legend will be appended. The completed map will be displayed in a RockPlot2D tab.
Hmmm - this map looks too busy. Let's go back and change a few of the labeling settings:
- Leave the map open, and click the Options tab to the left of the Untitled map tab.
- Adjust a few settings:
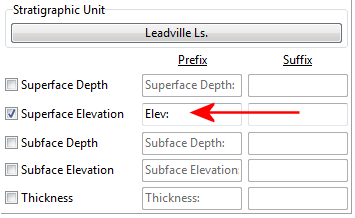
- Click on the 2D Grid Map | Map Overlays | Borehole Locations tab.
- Click the Stratigraphy Data tab and edit the Prefix for the Superface Elevation to: Elev
-
- Click on the Label Options tab, at the bottom of the Borehole Locations tabs, and change the Font Size setting to: 1 (previously was 2.0)
- Click the Continue button again to recreate the map.
RockWorks will recreate the contours and other map layers, and display the results in a new map tab.
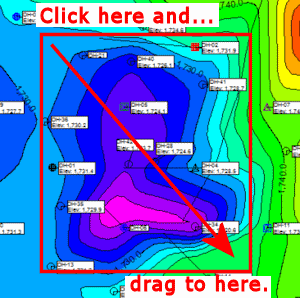
- Zoom into the view:
- Click the Zoom-In toolbar button.

- Draw a rectangular zoom region.
- Edit the contour line's label.
- Click the Edit button in the toolbar.

- Click on the labeled contour line. The program will display it with handles at each polyline inflection point.
- Right-click on the line, and choose Properties.
- Change the Font Color to red.
- Click Apply and Close.
- The program will display the font label in red.
- Zoom back out: click the Zoom-Out button.

- Close this window by clicking on the Close button (X) in the upper-right corner. You can answer no to the do-you-want-to-save prompt.
 Creating 2D Stratigraphic Structure Maps

RockWare home page

