RockWorks | Utilities | 3-D | Sphereplot | 3D Sphere - Points
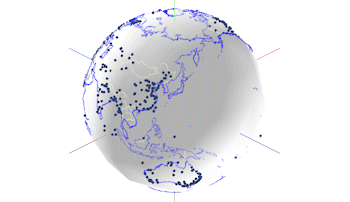
This program creates a dynamic spherical display in RockPlot3D. It reads user-entered longitude and latitude coordinates from the main datasheet for plotting of individual points on the global map. It also offers global reference items (coastlines, islands, rivers) from a program database. (See the EarthApps for point maps output to Google Earth.)
Applications include seismic events, volcanoes, ocean temperatures, atmospheric temperatures, etc. Note that our discussion refers to the planet Earth but, aside from the Earth-specific geographical features, you can certainly apply this tool to other spherical bodies.
Menu Options
Step-by-Step Summary
- Data Columns: These prompts tell RockWorks which columns in the current datasheet contain the input coordinates.
Click on an existing name to select a different name from the drop-down list. See a sample data layout below.
- X (Longitude), Y (Latitude): Select the columns in the main datasheet that contain the longitude (east/west) and latitude (north/south) coordinates for individual points to be plotted on the cylindrical map. These selections will be ignored if the Symbols option, below, is not activated.
- Longitudes in the Western Hemisphere (e.g. North & South America) must be entered as negative values.
- Longitudes in the Eastern Hemisphere (e.g. Asia & Australia) must be entered as positive values.
- Latitudes in the Southern Hemisphere (e.g. Australia) must be entered as negative values.
- Latitudes in the Northern Hemisphere (e.g. Siberia) must be enteres as positive values.
- The longitudes and latitudes must be entered in decimal degrees. If your data is in degrees/minutes/seconds, you must first use the Coords | Coordinate Converter - Multiple Points conversion utility first.
- Points
- Points: Insert a check in this box if there are point locations listed in the main RockWorks data sheet that are to be plotted as spheres on the 3D spherical map. These locations should be specified in the Data Columns tab as described above. Click on this tab to establish the point settings.
- Color
- Fixed: Click in this radio button for all spheres to be plotted in the same color. Click the color box to select the color.
- Variable: Click here if the spheres are to be colored differently. Select the name of the column in the datasheet that lists the individual point colors.
- Size
- Fixed: Click in this radio button if the spheres are to be plotted at a constant size. Enter the dimensions for the sphere radii in kilometers.
- Variable: Click here if the spheres are to be variably sized, based on values in the datasheet. Select the column in the datasheet in which the sphere radii in kilometers are listed.
- Radius: This determines how far out from the middle of the earth the point spheres will be plotted.
- Fixed: Click in this radio button to have all points plotted at the same distance from the earth center. Enter the distance for the sphere centers, in kilometer units. (default = 6378)
- Variable: Select this option if the spheres vary in their locations. Select the name of the column in the datasheet in which the radius distances are listed. This can be useful for displaying earthquake centers at varying depths or air samples at different atmospheric levels. Distances must be entered in kilometer units.
- Labels: Insert a check here to include labels with the symbols.
- Label Column: Click to select the datasheet column in which the label text is listed.
- Font: Click to define the font style, size, and color for the label text.
- Radius: This defines how far from the earth center the labels will plot, in kilometers. If you want the labels displayed at the same level as the points, be sure to enter the same value as you did for the sphere radius, above.
- Plot Leader Lines: If you would like small lines to connect the labels with their symbols, insert a check in this check-box.
- Features: Use this tab to select which reference spheres, if any, are to be plotted. The kilometer radii listed below are the defaults, but you can modify these as you wish.
- Output Options
- Save Output File: Check this to assign a name for the 3D scene in advance, rather than displaying it as Untitled.
- Automatic: Choose this option to have RockWorks assign the name automatically. It will use the name of the current program plus a numeric suffix, plus the ".Rw3D" file name extension.
- Manual: Choose this option to type in a name of your own for this RockPlot3D file.
- Display Output: Check this option to have the resulting log displayed in RockPlot3D once it is created.
- Access the RockWorks Datasheet program tab.
- Create a new datasheet and enter or import your listing the point coordinates to be plotted on the 3D spherical map.
Or, open one of the sample files and replace that data with your own. (In this example, the sample file = "\Documents\RockWorks Data\Samples\Cities_Of_The_World.rwDat".)
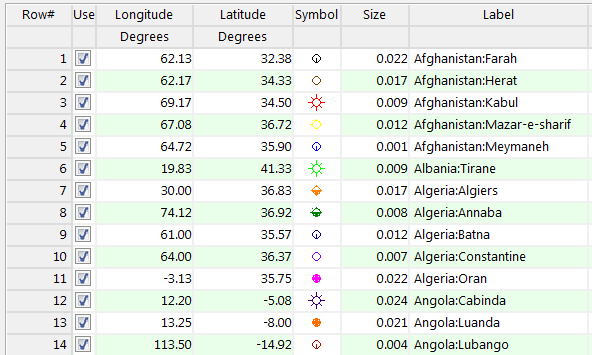
Longitude and latitude coordinates must be in decimal format. Additional data columns can include colors and radius measurements from earth center.
- Select the Utilities | 3-D | SpherePlot | 3D Sphere - Points option.
- Establish the requested menu settings, described above.
- Click the Process button to continue.
The program will create an image that includes the requested points, labels, and/or available reference layers. The completed map will be displayed in a RockPlot3D tab in the options window.
- You can adjust any of the settings in the Options window (symbol options, annotations, etc.) and then click the Process button again to regenerate the 3D diagram.
- View / save / manipulate / export / print the map in the RockPlot3D window. (You can drill down to the individual components of the 3D view by expanding the Sphere group in the Data pane.)
 Back to 3-D Menu Summary

RockWare home page