RockWorks | Utilities | 3-D | Triangle Mesh
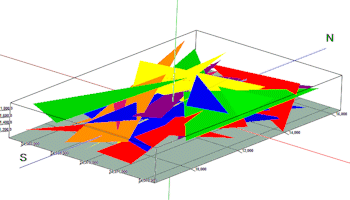
This program is used to plot a series of colored triangles in 3-D space. The input consists of a datasheet which contains the coordinates for each triangle vertex.
Menu Options
Step-by-Step Summary
- Data Columns: These prompts tell RockWorks which columns in the current datasheet contain the input coordinates and other data.
Click on a displayed name to select a different name from the drop-down list.
- Title Column: Select the column in the current datasheet that defines the triangle title. This title will be used when grouping the triangles within the RockPlot3D data tree.
- Color Column: Select the column that defines the triangle color.
- X1 Column: Choose the column that contains the X (Easting) coordinate for the first triangle vertex.
- Y1 Column: Select the column that contains the Y (Northing) coordinate for the first triangle vertex.
- Z1 Column: Select the column that contains the Z (Elevation) coordinate for the first triangle vertex.
- X2 Column: Choose the column that contains the X (Easting) coordinate for the second triangle vertex.
- Y2 Column; Select the column that contains the Y (Northing) coordinate for the second triangle vertex.
- Z2 Column: Select the column that contains the Z (Elevation) coordinate for the second triangle vertex.
- X3 Column: Choose the column that contains the X (Easting) coordinate for the third triangle vertex.
- Y3 Column: Choose the column that contains the Y (Northing) coordinate for the third triangle vertex.
- Z3 Column: Choose the column that contains the Z (Elevation) coordinate for the third triangle vertex.
- Thickness: Thickness (in pixels) of each triangle.
Be sure to define the coordinate system and units for all of the vertices.
- Style
- Outline Only: Click in this option to plot the triangle outlines only. Enter the pixel width for the lines.
- Filled Triangles: Click in this option to fill the triangles with the color defined in the datasheet, whose input column you defined above.
- Other 3D Diagram Options
Use these checkboxes to append other layers to your 3D scene.
Click each tab to set up the 3D diagram layers (images, infrastructure, reference cage, etc.).
- Output Options
- Save Output File: Check this to assign a name for the 3D scene in advance, rather than displaying it as Untitled.
- Automatic: Choose this option to have RockWorks assign the name automatically. It will use the name of the current program plus a numeric suffix, plus the ".Rw3D" file name extension.
- Manual: Choose this option to type in a name of your own for this RockPlot3D file.
- Display Output: Check this option to have the resulting log displayed in RockPlot3D once it is created.
- Access the RockWorks Datasheet program tab
- Create a new datasheet and enter or import your XYZ location triplets, sample IDs, and colors into the datasheet.
Or, open one of the sample files and replace that data with your own. See 3D Triangles Data format for details.
- Select the Utilities | 3-D | Triangle Mesh menu option.
- Specify the requested menu items, as described above.
- Click the Process button to continue.
The program will read the indicated XYZ location coordinates and plot a triangle between the points, using the color specified. The diagram will be displayed in a RockPlot3D tab in the Options window.
- You can adjust any of the options along the left and click the Process button to regenerate the 3D image.
- View / save / manipulate / print / export the image in the RockPlot3D window.
 Back to 3-D Menu Summary

RockWare home page