A Polygon Table contains a listing of X (Easting) and Y (Northing) coordinates that identify the boundary vertices of a polygonal area. You can use this polygon to filter grid values (Grid | Filter), solid model values (Solid | Filter), stratigraphy models (Stratigraphy | Model, Fence, etc). You can also plot the polygon outline in RockPlot2D.
! You can store multiple Polygon tables in your project database. If you assign detailed names they'll be easy to distinguish when you're selecting which to use. Polygon tables can be accessed via the Project Manger tab, under the Project Tables | Map/Model Tables grouping.
- Use the Draw | Line Types | Polygon tool in RockPlot2D to draw a polygon on a map, and then capture the vertex coordinates in a Polygon Table. See Drawing Polygons for details.
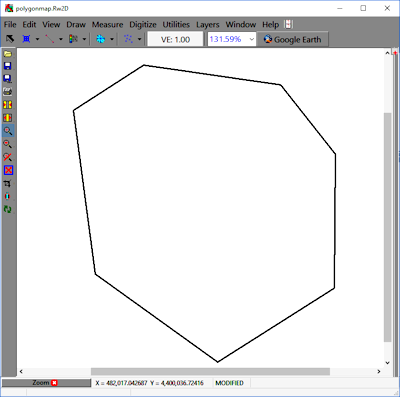
These tables have a very simple format. Below is an example of a Polygon Table as displayed in the program editor, along with a graphic example of how this polygon looks when plotted.
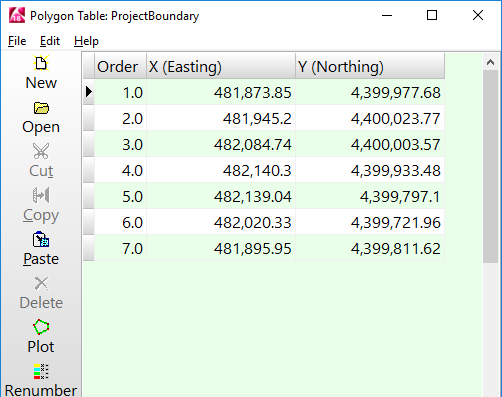
- Polygon tables contain 3 columns:
- Order: Because this table is stored in the project database, an ordering number is important so that the vertices are stored in the proper order (and not re-sorted numerically). You don't need to enter this number - they'll be assigned automatically - but you can edit them should you wish to re-order the vertices.
- X (Easting) and Y (Northing): The X and Y coordinates that define points along the perimeter of the polygon to be used to "clip" the input grid or solid model file. The X coordinate is listed in the first column, and the Y coordinate in the second.
- Each coordinate pair, representing a single perimeter point, is listed on a separate line.
- The coordinates must be in the same units as the X and Y coordinates represented in the grid or model to be filtered.
- The polygon can be made up of three or more coordinate pairs.
- Only a single polygon can be defined in a single table, though you can maintain multiple tables in your project database.
- The beginning coordinate pair does not need to be repeated at the end of the coordinate listing in order to close the polygon.
- You may list as many X,Y coordinate pairs as necessary to define your polygon vertices.
To plot the polygon outline defined in the current Polygon Vertices Table
- Click on the Plot Polygon button
 or select the Plot Polygon command in the Polygon Vertices editor to create a plotted image of the polygon outline.
- Set up the map options:
- Style/Color: Click on the box to the right to choose the line style and color for the polygon outline.
- Fill Color: Click on the color box to the right to choose the fill color for the polygon.
- Borehole Locations: Check this box if you wish to display a borehole location map layer along with the polygon. Expand this heading to define the borehole symbol and label options.
- Border: Check this box if you wish to include a map border with the polygon. Expand this heading to define the border settings.
- The completed map illustrating the polygon will be displayed in RockPlot2D. You can use RockPlot's File | Print command to print the polygon outline, File | Export to export the image to another graphic format, File | Save to save the image, File | Append to append the polygon image to another .Rw2D file, and so on. (See RockPlot2D Overview for more information about viewing, saving, editing, and printing graphics.)

RockWare home page