RockWorks | ModOps | Grid | Math | Add Multiple Grids
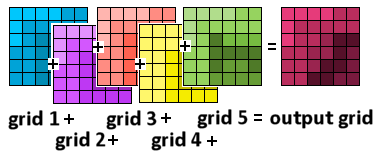
This program adds the node values in multiple existing grid models (.RwGrd files) whose names are listed in the current datasheet.
Example: Add together thickness values in four isopach grid files to determine total thickness of adjacent beds.
! In order for the program to match up corresponding nodes in the input grid files, they ALL must have the same dimensions (X and Y coordinates and range) and numbers of nodes. If you aren’t sure of the "size" of any grid file, use the Grid | Statistics | Report option to obtain a summary. See Resampling Grid Models if you need to re-dimension an .RwGrd file. See Grid & Grid Math if you need to perform other arithmetic operations on two grid models.
Menu Options
Step-by-Step Summary
- Options
- Output Grid: Click to the right to type in the name to assign to the new grid file (.RwGrd) that the program will create, which results from adding together the grid models.
- File Name Column: Select the name of the column in the current datasheet where the names of the input grid models are listed.
- 2D Grid Map
Check this box to display the output grid as a 2D map at this time.
Click this tab to set up the 2D map layers (bitmap, symbols, labels, line contours, color-filled contours, labeled cells, map border, etc.).
- 3D Grid Diagram
Check this box to display the output grid as a 3D surface at this time.
Click this tab to set up the 3D map layers (surface colors, images, reference cage, etc.).
! You can request both a 2D and 3D representation of the grid model.
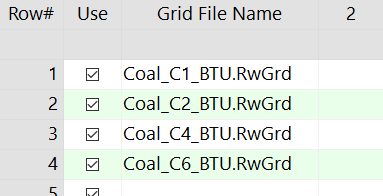
- Open or create a datasheet in which the names of the existing grid models to be added together are listed. Here is a very simple example of how this datasheet might look:
- Select the ModOps | Grid | Math | Add Multiple Grids menu option.
- Enter the requested menu settings, described above.
- Click the Process button to continue.
The program will read the input grid models in sequence, adding the node values together. It will store the resulting grid file in the project folder under the output file name you specified.
The requested diagram(s) will be displayed in a RockPlot2D tab and/or RockPlot3D tab in the Options window.
- You can adjust any of the settings in the Options window and then click the Process button again to regenerate the diagram(s).
- View / save / manipulate / export / print the diagram in the RockPlot2D or RockPlot3D window.
 Back to Grid Menu Summary

RockWare home page