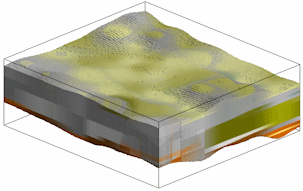
- Voxels: Click in this radio button to represent the color model in the 3D display as color-coded voxels.
-
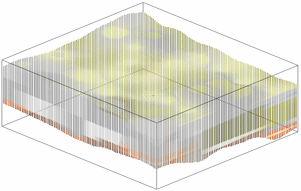
- Points: Click in this button to represent the color model as color-coded points, as in the example below. This display renders much more quickly than the voxel versions.
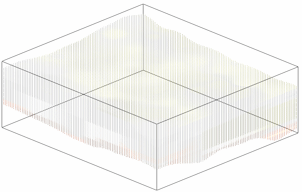
! Note: You can toggle between Voxels and Points in RockPlot3D after the model is displayed. You can also change the point thickness, as shown below.
- Striplogs: Append striplogs to your 3D scene. (More info)
- Draped Image: Include an image in this 3D scene, draped over an existing grid surface. (More info)
- Floating Image: Include an image in this 3D scene, floating at a specified elevation. (More info)
- Points: Display the 3D control points in the diagram. (More info)
! Note: This option only applies to the data that is loaded into the current Datasheet. If the data is being loaded from an ASCII file, thereby bypassing the datasheet, the Control Points setting will have no effect (i.e. no control points will appear within the final diagram) - Perimeter Cage Include a 3D reference cage around the solid diagram. (More info)
- Legends: Include one or more legends with the diagram. (More info)
- Infrastructure: Display buildings, pipes, or other infrastructure with your 3D scene. (More info)
- Faults: Include 3D fault triangle meshes with this scene. (More info)
- Other 3D Files: Include other, existing, RockPlot3D ".Rw3D" files in this scene. (More info)