RockWorks | Borehole Operations | Striplogs | XYZ -> Optimum Path
This program is used to compute the optimum (least curvature) path for a polyline (e.g. well bore, tunnel) that passes through a series of xyz points or intercepts. The input consists of a list of the XYZ intercept points. These intercepts might include seismic "hot spots" for a horizontal oil and gas well or vertical shaft locations that a planned tunnel must intersect. RockWorks uses the Catmull-Rom spline equation to calculate the optimum path.
Once the optimum path is computed, the program can output any of the following:
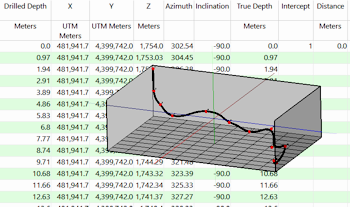
- A report listing the total distance (e.g. drilled depths), xyz coordinates, azimuth (bearing), inclination (dip), true vertical depth (relative to the initial XYZ point), and vertices that correspond to the intercept points and their closest distance from the path.
- A report listing the downhole survey depths, bearings, and inclinations at the increment points.
- A 3D display displaying the intercept points, the computed path, and offset lines.
 Watch Video: http://youtu.be/kcq9HAqhcC4
See also
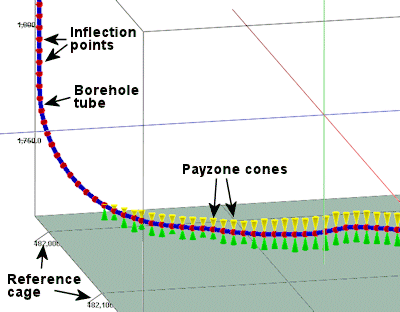
Computing Optimum Wellbore Paths Using Payzone Grids.
Feature Level: RockWorks Basic and higher
Menu Options
Step-by-Step Summary
- Data Columns: These prompts let RockWorks know which columns in the current datasheet contain the required data.
Click on an existing name to select a different name from the drop-down list. See a sample data layout below.
- X (Easting): Select the name of the column that contains the X-coordinates for the intercept points.
These can be Eastings in meters or feet, decimal longitudes, etc. See Defining your Datasheet Coordinates for more information.
- Y (Northing): Select the name of the column that contains the Y-coordinates for the intercept points.
- Z (Elevation): Select the column that contains the Z (elevation) coordinates for the intercept points.
Be sure you've defined the elevation units in the datasheet.
- Curve-Fitting: Click this tab to define the angularity of the polyline.
- Distance Increment: Type in the depth or distance increment at which the polyline path is to be computed. For example, if your input XYZ points were sampled every 15 feet, then you can use that as a starting place. Bear in mind that the smaller the increment, the smoother the path.
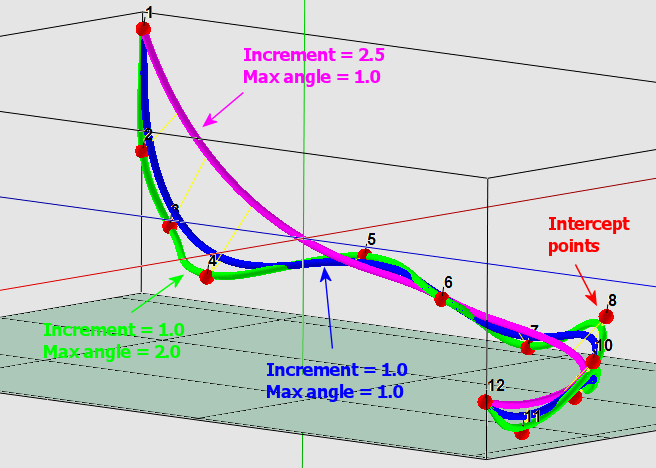
- Maximum Angularity: Click to the right to type in the maximum angle change that is allowed for each segment. The correct amount to enter will depend on the distance increment and the nature of the drilling environment. See examples below.
- Inclination: Choose how you want the inclination values to be recorded in the output reports.
- XYZ List: Insert a check in this box if you want the program to create an output report in which it will record the computed X,Y, and Z coordinates of the downhole survey, at the Depth Increment specified above. Click this tab to define the output format(s) for the report. (More info)
- RwDat (RockWorks): Click in this button if you want the report generated in a RockWorks datasheet (.RwDat) format.
- CSV (Excel): Click in this button if you want the report generated in a CSV file format for use in Excel.
- TXT (Notepad): Click in this button if you want the report generated in a text (.txt) format.
- RTF (Word): Click in this button if you want the report generated in an RTF file format for use in Word.
- Downhole Survey: Insert a check here if you want the program to create an output report in which it will record the drilled depths, azimuth (bearing), and inclination (dip) for the points along the proposed well. Click this tab to define the output format(s) for the report. (More info)
- RwDat (RockWorks): Click in this button if you want the report generated in a RockWorks datasheet (.RwDat) format.
- CSV (Excel): Click in this button if you want the report generated in a CSV file format for use in Excel.
- TXT (Notepad): Click in this button if you want the report generated in a text (.txt) format.
- RTF (Word): Click in this button if you want the report generated in an RTF file format for use in Word.
- 3D Diagram
Check this to output a 3D display of the well. Click this tab to set up the 3D output.
- Diagram Options: Use these settings to adjust the appearance of the output diagram.
- Intercept Points (Spheres): The source XYZ points will be displayed in the 3D scene as colored spheres.
- Radius: Type in the radius for the spheres, as a percent of the project size.
- Color: Click the color box to choose the color for the intercept spheres.
- Path (Tube): The computed polyline path will be displayed in the 3D scene as a tube.
- Radius: Enter the radius for the 3D tube which will plot along the computed path.
- Color: Click to choose a color for the tube.
- Intercept/Path Connectors (lines): Connecting lines will be drawn between the source intercept points and the computed tube.
- Thickness: Type in the thickness for the lines. 1 = thin, 3 = thick
- Color: Choose a color for the connector lines.
- Intercept Labels: The intercept spheres will be labeled with their sequential numbers.
- Font: Select the font style, size, and color.
- Offset: Enter the offset of the labels from the spheres, as a percent of the project size, in the X, Y, and Z directions. You can enter either positive or negative values
- Include Leader Lines: Check this box to include small lines between the labels and the spheres.
- Other 3D Diagram Options
Use these checkboxes to append other layers to your 3D scene.
Click each tab to set up the 3D diagram layers (images, reference cage, etc.).
- Output Options: Use these settings to define whether the output scene is to be saved (or displayed as "untitled"), how the file should be named, and whether it is to be displayed after it is created. It also offers export options. (More info)
- Access the RockWorks Datasheet program tab.
- Create a new datasheet and enter or import your XYZ intercept points.
Or, open one of the sample files and replace that data with your own.
! Click the Example button at the top of the window to load a sample file that is installed with the program.
Here is an example of how a data file might look.
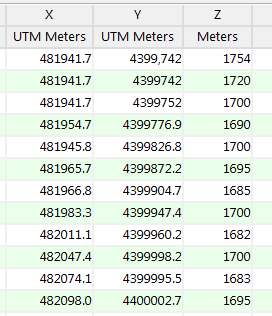
Longitude and latitude coordinates must be in decimal format. If you're using another coordinate system, be sure you've specified the Units and the Projection Settings as appropriate.
- Select the Striplogs | XYZ -> Optimum Path option from the Borehole Operations menu.
- Enter the requested program settings, described above.
- Click the Continue button to proceed.
The program will compute the path between points at the requested distance increment and maximum angle. It will generate the requested output reports and/or diagrams, and display them if requested.
- The XYZ report will list drilled depths, XYZ points at those increment locations, azimuth and inclination of the path at those points, true depths at those points, intercept point number (if present), and distance from intercept point to the computed path.
- The Downhole Survey report will list the measured depth, azimuth bearing and inclination survey values. If you wish to enter this into the database for a boring in your project, copy the output report, click on that hole's Orientation table, click on the "Datasheet" button for a quick editor, and paste in the survey data.
- The 3D diagram will illustrate the intercept points, pathway tube, and labels as requested.
Here are some examples of the effect of the distance increment and maximum angularity on the computed path. These examples were generated using the sample data file "XYZ_to_Path_01.rwDat".
 Back to StripLogs Menu Summary

RockWare home page