RockWorks | Borehole Operations | Striplogs | Payzone - Optimum Path
This program is used to compute the optimum path for a hypothetical wellbore, given a starting XYZ point, an ending XY location, upper and lower payzone grid models, and borehole curvature, smoothing, and depth increment settings.
Once the optimum path is computed, the program can output any of the following:
- A report listing the XYZ coordinates, true depths, and formation thickness, along with the survey values.
- A report listing the drilled depths, azimuth (bearing), and inclination (dip) for the points along the proposed well.
- A 2D cross-section diagram representing the wellbore path and payzone.
- A 3D display illustrating the well axis with a tube, and the payzone thickness with cone-shaped symbols along the well path.
! Assumptions:
- The wellbore starts out vertically.
- True depth within the XYZ report is relative to the initial point – not the ground surface.
- There are no null nodes within the grids along the course of the wellbore.
- The grid models (RwGrd files) for the top and base of the payzone already exist in the project. These can be imported, or created in RockWorks using its stratigraphy modeling or other grid-based tools.
 A video that demonstrates these capabilities can be viewed at: http://youtu.be/gLRuNCKhkUc
See also
Computing Optimum Wellbore Paths Using XYZ Points.
Feature Level: RockWorks Basic and higher
Menu Options
Step-by-Step Summary
- Input
- Initial Point: Use these settings to define the location of the start of the wellbore. These must match the coordinate system and units currently established for the other holes in the borehole database.
- X (Easting): Type in the X coordinate for the top of the well.
- Y (Northing): Type in the Y-coordinate for the top of the well.
- Z (Elevation): Type in the Z (elevation) coordinate for the top of the hole.
- Final Point: Use these settings to define the map location for the end of the wellbore. Note that the final elevation will be determined by the payzone grid models and borehole properties defined below.
- X (Easting): Enter the X coordinate for the end of the well.
- Y (Northing): Enter the Y-coordinate for the end of the well.
- Borehole Properties: Use these settings to define the angularity of the hole.
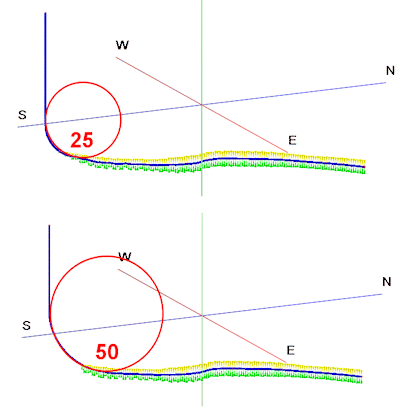
- Radius of Curvature: Type in the radius of the circle that will best fit the optimal well path. The greater the value you enter, the larger the circle, and the more gradual the well curve to horizontal. Some examples are shown below.
-
- Depth Increment: Type in the depth or distance increment at which the path is to be computed. The smaller the increment, the smoother the path.
- Smoothing Factor: Click to the right to type in the number of smoothing passes to run on the path.
- Target (Pay-Zone): Use these settings to define the top and base surfaces for the formation of interest, into which the wellbore will be projected.
- Superface (Top) Grid Model: Browse for the name of the existing grid model (.RwGrd file) that represents the surface at the top of the formation of interest. This could be a surface generated using the Stratigraphy modeling tools in RockWorks, or a grid that you've imported from another source.
- Subface (Base) Grid Model: Browse for name of the existing grid model that represents the surface at the base of the formation of interest.
- XYZ List: Insert a check in this box if you want the program to create an output report in which it will record the computed X,Y, and Z coordinates of the downhole survey, at the Depth Increment specified above. Click this tab to define the output format(s) for the report. (More info)
- RwDat (RockWorks): Click in this button if you want the report generated in a RockWorks datasheet (.RwDat) format.
- CSV (Excel): Click in this button if you want the report generated in a CSV file format for use in Excel.
- TXT (Notepad): Click in this button if you want the report generated in a text (.txt) format.
- RTF (Word): Click in this button if you want the report generated in an RTF file format for use in Word.
- Downhole Survey: Insert a check here if you want the program to create an output report in which it will record the drilled depths, azimuth (bearing), and inclination (dip) for the points along the proposed well. Click this tab to define the output format(s) for the report. (More info)
- RwDat (RockWorks): Click in this button if you want the report generated in a RockWorks datasheet (.RwDat) format.
- CSV (Excel): Click in this button if you want the report generated in a CSV file format for use in Excel.
- TXT (Notepad): Click in this button if you want the report generated in a text (.txt) format.
- RTF (Word): Click in this button if you want the report generated in an RTF file format for use in Word.
- 2D Profile
Check this to create a 2-dimensional cross section diagram, parallel to the well bearing, showing the well axis and payzone thickness. Click on this tab to set up the section.
- Labeled Axes
Click on this tab to establish title, border, axis labels, and other perimeter settings for the section. (More info)
- Other 2D Files
Check this option to include existing RockWorks diagrams as layers with your section.
Click on this tab to select the existing .Rw2D files to be included. (More info)
- Peripherals
Check this option to include various peripheral annotations with your cross section. Options include titles, text blocks, legends, and more.
Click on this tab to activate the items and establish their settings. (More info)
- Border
Check this option to include a solid line border around the entire cross section image.
Click on this tab to establish border settings.
- Output Options: Use these settings to define whether the output graphic is to be saved (or displayed as "untitled"), how the file should be named, and whether it is to be displayed after it is created. It also offers export options. (More info)
- 3D Diagram
Check this to output a 3D display of the well. Click this tab to set up the 3D output.
- Diagram Options: Use these settings to adjust the appearance of the output diagram.
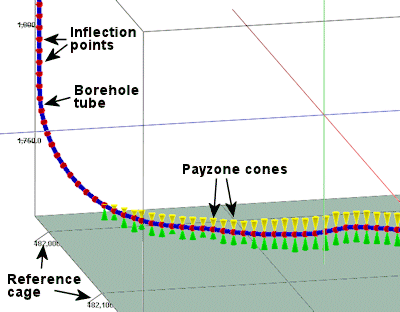
- Plot Inflection Points: Check this box to plot spheres along the well path at the depth increments defined above.
- Point Radius: Enter the point radius, as a percent of your project size (default = 1.0). The larger the value, the larger the spherical symbol.
- Point Color: Click the color box to select the color for the inflection points.
- Plot Borehole Tube: Check this box to display the well path with a 3D tube.
- Tube Radius: Enter the tube radius, as a percent of your project size (default = 1.0).
- Tube Color: Click the color box to choose the color for the 3D tube.
- Plot Pay-Zone Top/Bottom Cones: Check this box to include cone symbols which extend from the wellbore tube to the top and base payzone surface you defined above.
- Cone Radius: Enter the cone radius, as a percent of your project size (default = 1.0).
- Upper Cone Color: Select the color for the upper cones (shown in yellow above).
- Lower Cone Color: Choose the color for the lower cones (shown in green above).
- Other 3D Diagram Options
Use these checkboxes to append other layers to your 3D scene.
Click each tab to set up the 3D diagram layers (images, reference cage, etc.).
- Output Options: Use these settings to define whether the output scene is to be saved (or displayed as "untitled"), how the file should be named, and whether it is to be displayed after it is created. It also offers export options. (More info)
- Select the Payzone - Optimum Path option from the Borehole Operations | Striplogs menu.
- Enter the requested program settings, described above.
- Click the Continue button to proceed.
The program will compute the optimum borehole path between the starting and ending point within the specified payzone surfaces, given the borehole parameters and depth increment you specified. It will generate the requested output reports and/or diagrams, and display them if requested.
- The Downhole Survey report will list the drilled depths, and the azimuth and inclination of the path at those points. If you wish to enter this into the database for a boring in your project, copy the output report, click on that hole's Orientation table, click on the "Datasheet" button for a quick editor, and paste in the survey data.
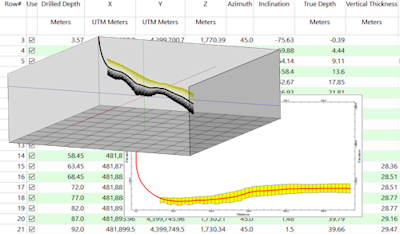
- The XYZ report will list drilled depths, XYZ points at those increment locations, azimuth and inclination of the path at those points, true depths at those points, vertical thickness of the payzone, if applicable, and comments, such as Kickoff depth.
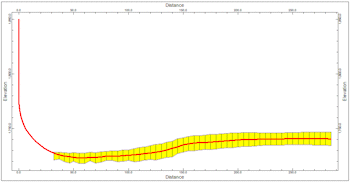
- The 2D cross section diagram will illustrate the well path and the payzone thickness. The thickness polygons will be plotted at the Depth Increment you declared above.
- The 3D diagram will illustrate the well path as a tube, inflection points as spheres, and payzone thickness as cones, as requested.
 Back to StripLogs Menu Summary

RockWare home page