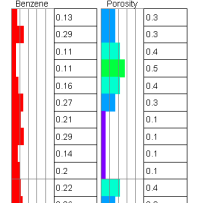
Insert a check in the Striplog I-Data check-box(es) to plot numeric interval data as bargraphs in the log. The I-Data Text check-box(es) can be used to include a column listing the numeric I-Data value labels. Up to 4 bargraphs and 4 numeric columns can be included in each log. The data is read from the RockWorks Borehole Manager's I-Data (Intervals) table.
When you click on the I-Data or I-Data Text items in the Visible Items pane or the Layout Preview window you’ll see the following settings in the Options pane to the lower-right. Note that you can activate any/all of the I-Data bargraph and text columns (and establish their settings) independently.
- I-Text Columns for information about plotting alpha-numeric information in your log.
I-Data #1 - #4
I-Data Text
- Track: Click here to select the column of values in the I-Data table you wish to plot for the selected bargraph (#1, #2, #3, #4). When you click on this item, the program will display the current list of column names; click on a name to make a selection. Each I-Data column you activate in the log can read from a different track.
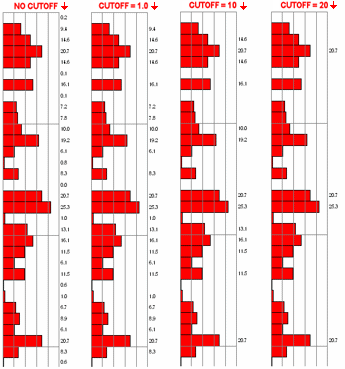
- G-Value Filter: Insert a check here to discard or replace high and/or low data values from the selected track for display in the logs. Subsequent automatic scaling of the I-Data columns will be based on the resulting G value range. (More info)
- Resample: Check this box to resample the data from the selected track for display in the logs. This is very useful when dealing with large datasets with closely sampled downhole data. (More info)
- Column Layout
- Left Margin: Determines the space between the bargraph column and the item to its left, as a percent of the project output dimensions. The greater the value, the wider the space. Default = 0.1.
! Entering a negative Left Margin value will position the column overlapping the column to the left.
- Width: This setting establishes the width of the bargraph column on the log, as a percent of the project output dimensions. The greater the value, the wider the column. Default = 1.
- Column Title:
- Automatic: Choose this option for the column to be labeled automatically with the name of the track you selected above.
- Manual: Choose this option to enter your own title for the column. If no title is desired, choose Manual and leave the field blank.
- Font: This establishes the size for the title as a percent of the output dimensions. A smaller size setting creates smaller text characters. You can define the text angle and color.
- Vertical Offset: Determines how far above the column the title will be plotted. If you expect to apply vertical exaggeration of 5x or more to your log or section, you might consider a value of 0.
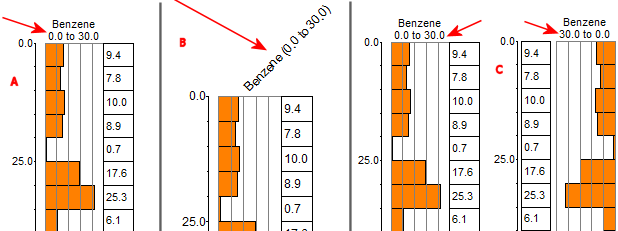
- Include Data Range: Insert a check here to include the min and max values for the column as part of the column. (This can be plotted even if the Title, above, is blank.)
- If the title angle is 90 degrees, the data range will be inserted between the column title and the top of the striplog (see A below).
- If the title angle is not horizontal, the data range will be inserted in parentheses after the title text (see B below).
- The data range labels will honor the left-to-right / right-to-left orientation of the curve (see C below).
-
- Perimeter: Insert a check here to border the column with a line style and color that you choose.
- Subdivisions: If activated, the program will display on the bar graph a series of vertical lines to function as a visual reference for the magnitude of the bars.
- Intervals: This setting adjusts the number of divisions to be represented by the background lines.
- Style: Choose the style and color for the background lines.
- Plotting Sequence: Choose Foreground for the lines to plot on top of the bars, or Background for the lines to plot behind the bars.
- Scaling: This controls how the range of data is plotted within the available column width. Click one of the available radio buttons:
- Automatic: RockWorks will scan the range of value in the specified Track for all of the active boreholes, thus determining the project’s minimum and maximum interval-data values sampled. It will then assign the inside of the bar graph column to the project’s minimum value and the outside of the column to the project’s maximum. Benefits: If you are plotting multiple boreholes, this assures that the data is plotted at the same scale in all logs.
- Manual: you can establish the interval-data value to correspond to the minimum and maximum edges of the bar graph column. Let’s say, for example, that your contaminant values in all wells ranged from .05 to .9, you might want to set the Minimum to 0 and the Maximum to 1. Use the Clip setting to cut off any bars that exceed the column maximum. Note that if you enter 0 for the minimum and choose Logarithmic scaling (below), RockWorks will substitute a non-zero value automatically.
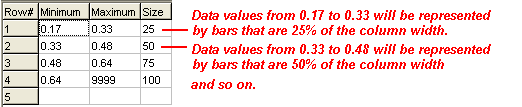
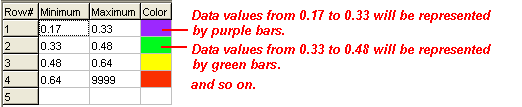
- Table Based: Choose this option if you want the bars to be scaled as defined in a table that you've created. This can be very valuable to highlight anomalies.
- ! Note that the plotting direction, established below, determines which edge of the column is assigned the minimum value and which is assigned the maximum.
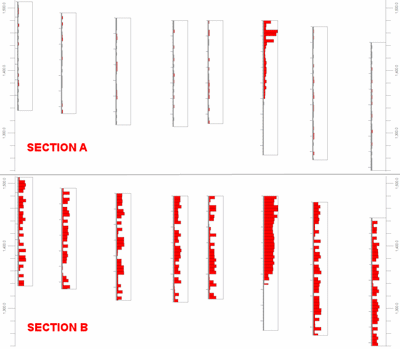
- Logarithmic: Insert a check here if you want to plot the natural logarithms of the I-data values. In Section A (below), the data is plotted with the logarithmic option disabled. One of the logs contains some very high values. As a consequence, the variations within the low values in the other logs is virtually indistinguishable. The logs in Section B are logarithmically scaled. Notice how the variability within the lower ranges become readily apparent.
- Fill Options: Click here to select how the 2D bars are to be filled.
- Fill Style
- None: Choose this for no fill.
- Monochrome: Choose this to fill with a solid color; click the color box to choose the fill color.
- Variable: Choose this to fill the bars with color that will vary based on the I-Data value at that point (low values in cold colors, high values in hot colors).
- Pattern: Choose this to fill the bars with a selected pattern design. Click on the pattern sample to choose a new pattern and foreground/background colors. See Selecting Patterns for details.
- Table Based: Choose this option if you want the bars to be colored as defined in a table that you've created. This can be very valuable to highlight anomalies.
- Table name: Click here to select the name of the color-fill table to be used to color the I-Data bars.
-
- Direction
- Left-to-right: Click in this button if the minimum value is to coincide with the left edge of the column and the maximum value with the right edge. The data will plot left-to-right.
- Right-to-left: Click in this button if the minimum value is to coincide with the left edge of the column and the maximum value with the right edge. The data will plot left-to-right.
- Interval Borders: If activated, this option will plot a solid-line border around the bars in the color you select.
- Line Style: Choose the lines style for the borders.
- Column Layout
- Left Margin: Determines the space between the I-Data text column and the item to its left, as a percent of the project output dimensions. The greater the value, the wider the space. Default = 0.
! Entering a negative Left Margin value will position the column overlapping the column to the left. This can be handy if you want to plot the labels on top of the I-Data bargraph column. If you set the negative offset to equal its width (established below), the entirety of the text column will overlay the log column immediately to the left.
- Width: This setting establishes the width of the I-Data text column, as a percent of the project output dimensions. The greater the value, the wider the column. Note that you may have to adjust this if you activate a number of the text fields, below. Default = 1.0.
- Column title: Click here to enter text to be displayed above the I-Data text column. If no title is desired, you can leave this field blank.
- Font: This establishes the size for the title as a percent of the project output dimensions. A smaller size setting creates smaller text characters.
- Vertical Offset: Determines how far above the column the title will be plotted. If you expect to apply vertical exaggeration of 5x or more to your log or section, you might consider a value of 0.
- Column Perimeter: Insert a check here to border the column with a line style and color that you choose.
- Interval Labeling
- Font: Establishes the size for the text as a percent of the project output dimensions. A smaller size setting creates smaller text characters. Default = 0.5
- Fill Interval: Insert a check here if you want the background of the text column to be opaque. (This can be helpful when the logs overlie an interpolated panel, for example.) Click in the color box to select the Fill Color.
- Depths: If checked, the interval depths will be included.
- Thicknesses: Plots each interval's thickness on the log. Thickness is computed from the depth intervals listed in the I-Data datasheet. These values represent drilled (observed) thickness, not necessarily true thickness if the boring is inclined or deviated.
- I-Data Values: Plots the actual data measurements.
! The text will wrap within the column, but be mindful that long labels may wrap onto the next interval down the log.
- Decimal Places: Click here to define the number of decimal places to be represented in the value labels.
- Omit Low Value Labels: Insert a check in this box if I-Data values lower than a specified minimum are to be omitted from the plot. This can be helpful to avoid plotting low-value background measurements. Enter the low-value cutoff in the prompt box.
-
- Borders: Insert a check here if you want to include solid line borders around the text intervals. Be warned that any long labels may extend outside a too-narrow column. If this happens, increase the column width and/or decrease the font size, above.
- Vertical Text Position: Select whether the text is to be placed at the top of the interval or the center.
 Back to 2D Striplog Options

RockWare home page