A "Color Fill Table" is used to define a listing of value intervals and their corresponding colors, to be used by the program when building 2D or 3D color-filled contour maps, solid models, etc. for which you have requested "Custom" color intervals. They can also be used to display a reference color index in RockPlot2D and ReportWorks.
! You can store multiple Color Fill tables in your project database. If you assign detailed names they'll be easy to distinguish when you're selecting which to use. Color Fill tables can be accessed in the Project Manger program tab, under the Project Tables | Map/Model Tables grouping.
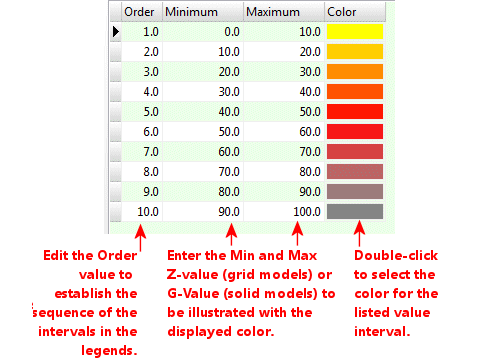
- You may list as many value intervals + colors as you wish. You may declare uneven and discontinuous intervals.
- ! If you need to verify the Z value range of your grid model, use the Grid | Statistics | Report command to view a grid summary. If you need to verify the G value range of your solid model, use the Solid | Statistics | Report command to view a solid model summary.
- Palette: Use the Palette button to generate a color-fill table based on a user-specified z-range/increment and a color scheme.
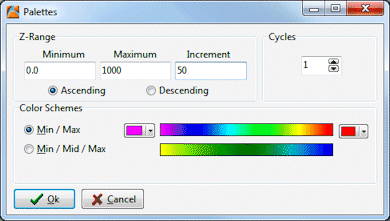
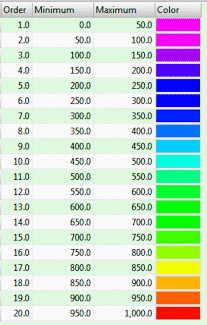
- For example, the settings within the menu above will produce the color table shown below, in which the colors range from cold-to-hot (purple to red) starting at a z-value of 0 and proceeding to 1000 at 50 unit increments, ascending order.
-
- The Ascending and Descending buttons allow you to reverse the order in which the values are listed in the table. This will only affect how the table is displayed in a graphic legend.
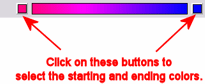
- The Min / Max option allows the user to select two "end members" for the color range.
-
- The Min / Mid / Max option allows the user to select two "end members" for the color range, and a middle color.
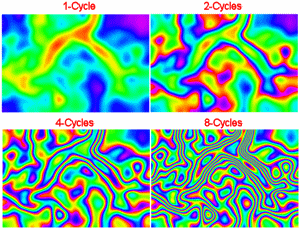
- The Cycles option will repeat the color palette by the specified iterations with the range of z-values (from z-min to z-max). The following examples depict various "Cycle" settings with rather psychedelic results.
-

RockWare home page