These tables are used to define the size of I-Data and T-Data bargraphs in 2D and 3D striplogs, as a percent of the column width, based on measured values. This can be a means of displaying background (low) values or anomalous highs in a meaningful manner.
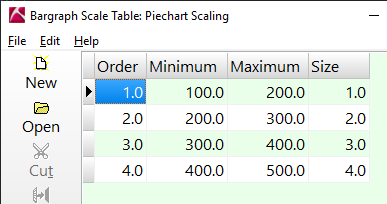
These tables are also used to define the size of mini-diagrams in piechart maps.
! You can store multiple Bargraph Scale tables in your project database. If you assign detailed names they'll be easy to distinguish when you're selecting which to use. Bargraph Scale tables can be accessed in the Project Manger tab, under the Project Tables | Log/Section Tables grouping.
These tables have a very simple format:
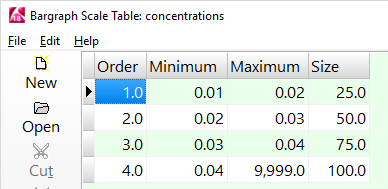
Map components: If you are using the table to scale mini-diagrams in a map, any data values in the designated size column that fall within the min-max range will cause the diagrams to be plotted in the map at the size declared to the right.
![]()