RockWorks | 3-D | Map | Sphereplot | 3D Sphere - Polylines
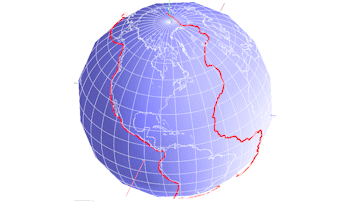
This program creates a dynamic spherical display in RockPlot3D. It reads user-created lists of longitude and latitude coordinates from external files (listed in the datasheet) which define the polygon vertices on the global map. It also offers global reference items (coastlines, islands, rivers) from a program database. (See the EarthApps for polyline maps output to Google Earth.)
Applications include fault lines, movement vectors, etc. Note that our discussion refers to the planet Earth but, aside from the Earth-specific geographical features, you can certainly apply this tool to other spherical bodies.
Menu Options
Step-by-Step Summary
- Data Columns: These prompts tell RockWorks which columns in the current datasheet contain the names of the linked polyline data files.
Click on an existing name to select a different name from the drop-down list. See a sample data layout below.
- File Name: Select the column in the datasheet that contains the names of the external text files listing the longitude and latitude coordinates for polyline vertices to be plotted on the map.
- Polyline Attributes
- Color: Click on the color box to choose a color for the polylines.
- Thickness: Click to specify the thickness for the polylines. 1= thin, 4 = very thick.
- Elevation: Click to the right to enter the distance for the polyline endpoints, in kilometer units. Tip: See the defaults listed below for the different earth and atmospheric structures for reference.
- Features: Use this tab to select which reference spheres, if any, are to be plotted. The kilometer radii listed below are the defaults, but you can modify these as you wish.
- Output Options
- Save Output File: Check this to assign a name for the 3D scene in advance, rather than displaying it as Untitled.
- Automatic: Choose this option to have RockWorks assign the name automatically. It will use the name of the current program plus a numeric suffix, plus the ".Rw3D" file name extension.
- Manual: Choose this option to type in a name of your own for this RockPlot3D file.
- Display Output: Check this option to have the resulting log displayed in RockPlot3D once it is created.
- Access the RockWorks Datasheet program tab.
- Create a new datasheet and enter or import your listing of polyline data files into the datasheet.
Or, open one of the sample files and replace that data with your own. (In this example, the sample file = "\Documents\RockWorks Data\Samples\Pipelines_Multiple.rwDat".)
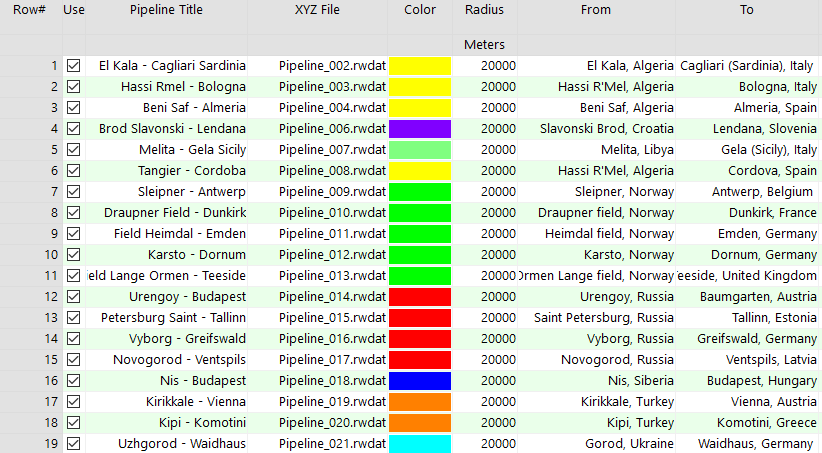
You can use the Columns | Column Properties menu option to establish the file-name column (such as "XYZ File" shown here) as containing linked data, specifically another .rwDat file. Doing so allows you to double-click in one of the cells to display the contents of the linked file.
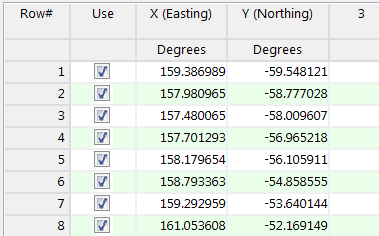
Each of the .RwDat files listed here needs to list the decimal longitude and latitude coordinates for the vertices of a single polyline:
- Select the Utilities | 3-D | SpherePlot | 3D Sphere - Polylines option.
- Establish the requested menu settings, described above.
- Click the Process button to continue.
The program will create an image that includes the requested point and/or polyline and available reference layers. The completed map will be displayed in a RockPlot3D tab in the options window.
- You can adjust any of the settings in the Options window (symbol options, annotations, etc.) and then click the Process button again to regenerate the 3D diagram.
- View / save / manipulate / export / print the map in the RockPlot3D window. (You can drill down to the individual components of the 3D view by expanding the Sphere group in the Data pane.)
 Back to 3-D Menu Summary

RockWare home page