RockWorks | Utilities | 3-D | Perimeter/Wall
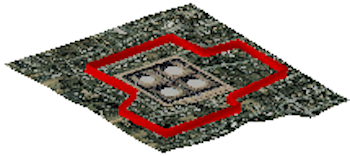
This program reads a list of X, Y coordinates and creates a series of vertical panels that may be used to show a project area perimeter within a 3D diagram.
Menu Options
Step-by-Step Summary
- Data Columns: These prompts are used to tell RockWorks which columns in the current datasheet contain the data to be processed.
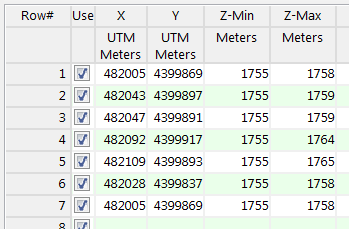
Click on an existing name to select a different name from the drop-down list. See a sample data layout below.
- X (Easting): Select the datasheet column that lists the X or Easting coordinates for perimeter vertices.
- Y (Northing): Select the datasheet column that lists the Y or Northing coordinates for perimeter vertices.
- Z-Min (Elevation): Select the column that contains the minimum elevation for the perimeter panels at this point.
- Z-Max (Elevation): Select the column that contains the maximum elevation for the panels at this point.
Be sure you have define the coordinate system and units for these columns.
- Color: Click on this item to specify the color to be used for the perimeter panels.
- Other 3D Diagram Options
Use these checkboxes to append other layers to your 3D scene.
Click each tab to set up the 3D diagram layers (images, infrastructure, reference cage, etc.).
- Output Options
- Save Output File: Check this to assign a name for the 3D scene in advance, rather than displaying it as Untitled.
- Automatic: Choose this option to have RockWorks assign the name automatically. It will use the name of the current program plus a numeric suffix, plus the ".Rw3D" file name extension.
- Manual: Choose this option to type in a name of your own for this RockPlot3D file.
- Display Output: Check this option to have the resulting log displayed in RockPlot3D once it is created.
- Access the RockWorks Datasheet program tab.
- Create a new datasheet and enter or import your vertex coordinates into the datasheet.
Or, open one of the sample files and replace that data with your own. (In this example, the sample file = "RockWorks Data\Samples\Project_Perimeter_01.rwDat")
- Select the Utilities | 3-D | Perimeter/Fence menu option.
- Enter the requested menu settings, described above.
- Click the Process button to continue.
The program will read the indicated XY location coordinates and create a connected series of panels between the coordinates, extending from the base to top elevations declared in the datasheet. They will be displayed in a RockPlot3D tab in the Options window.
- You can adjust any of the options along the left (color, elevation, etc.) and click the Process button to regenerate the 3D image.
- View / save / manipulate / print / export the image in the RockPlot3D window.
Tip: If you need help defining the perimeter coordinates, you can use the RockPlot2D Digitize | Polygon tool to digitize a polygon on a map, use the Options | Export | Datasheet option to save the XY coordinates to a datasheet file.
 Back to 3-D Menu Summary

RockWare home page