RockWorks | Borehole Operations | P-Data | Histograms by Lithology
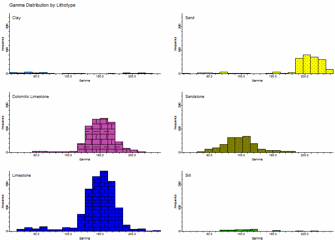
Use this program to read the values in a P-Data column and generate a series of frequency histograms that display the distribution of these values for each lithology type recorded downhole for the active boreholes in the project. The diagrams are generated on a single page for quick comparison. You can generate diagrams for all or for selected lithology types. The resulting diagram is displayed in a RockPlot2D pane within the Options window.
See also
Create a Frequency Histogram for a Single Column of P-Data Values
Feature Level: RockWorks Standard and higher
Menu Options
Step-by-Step Summary
- Spatial Filter
Use this tab at the top of the window to apply spatial filters to data being processed for the histograms. (More info)
- P-Data Track
Click to the right to select the existing P-Data column that contains the measurements to be analyzed.
- Diagram Options
- Create Report
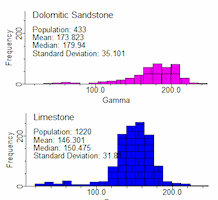
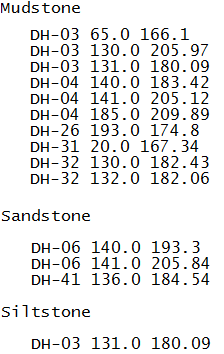
Insert a check here to create a report that lists a detailed summary of each of the lithology types.
Click this tab to define the output format(s) for the report. (More info)
- RwDat (RockWorks): Click in this button if you want the report generated in a RockWorks datasheet (.RwDat) format.
- CSV (Excel): Click in this button if you want the report generated in a CSV file format for use in Excel.
- TXT (Notepad): Click in this button if you want the report generated in a text (.txt) format.
- RTF (Word): Click in this button if you want the report generated in an RTF file format for use in Word.
-
- Other 2D Files
Check this option to include existing RockWorks diagrams as layers with the current diagram.
Click on this tab to select the existing diagrams (.Rw2D files) to be included. (More info)
- Peripherals
Check this option to include various peripheral annotations with your diagram. Options include titles, logos, and more.
Click on this tab to activate the items and establish their settings. (More info)
- Border
Check this option to include a solid line border around the entire diagram.
Click on this tab to specify the line style, thickness, and color.
- Output Options
- Save Output File: Check this to assign a name for the diagram in advance, rather than displaying it as Untitled.
- Automatic: Choose this option to have RockWorks assign the name automatically. It will use the name of the current program plus a numeric suffix, plus the ".Rw2D" file name extension.
- Manual: Choose this option to type in a name of your own for this file.
- Display Output: Check this option to have the resulting diagram displayed in RockPlot2D once it is created.
- Access the RockWorks Borehole Manager program tab.
- Enable/disable the boreholes to be processed by inserting/removing checks from the boxes next to their names.
- Activate the lithology types to be processed by inserting/removing checks from the Lithology Types table's Plot in Legend check-box. (You can also access the Lithology Types table from within this program's Options window.)
- Select the Borehole Operations | P-Data | Histograms by Lithology menu option.
- Establish the requested program settings, as discussed above.
- Click the Continue button to proceed with report and diagram generation.
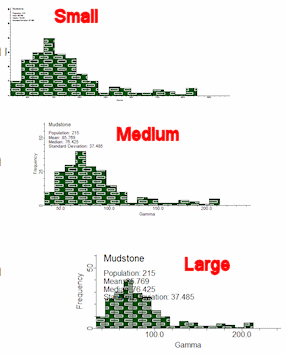
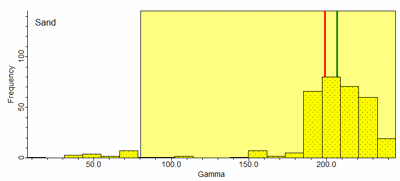
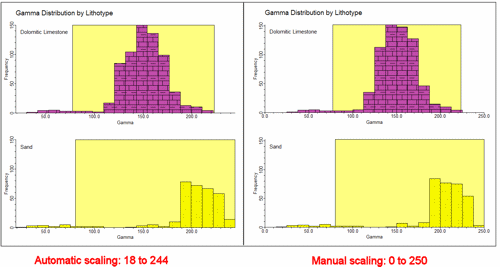
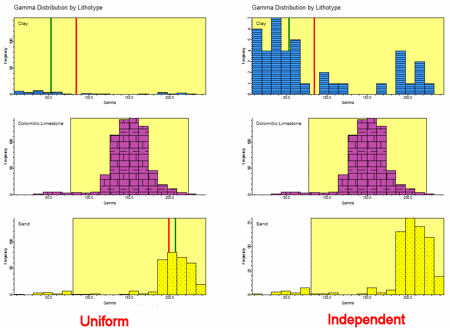
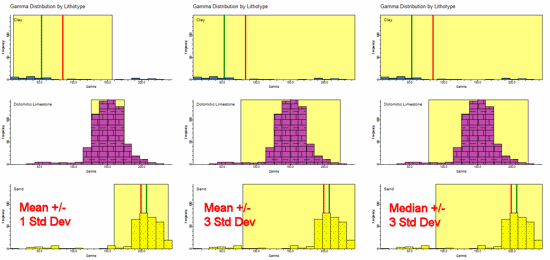
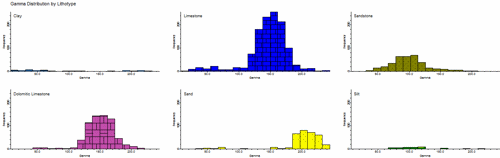
RockWorks will read the contents of the input P-Data track for each borehole and determine the corresponding lithology material at each measurement location. For each active lithology material types, it will build a frequency histogram showing the range of the P-Data values. The colors and patterns that are used to plot the histograms are based on the color/pattern assignments that are defined within the Lithology Types Table. These individual graphs will be combined into a composite diagram, displayed in a RockPlot2D tab in the Options window.
If you have requested an outlier report, it will be displayed in a text tab in the Options window.
- You can adjust any of the program settings in the main Options tab to the left and then click the Continue button again to regenerate the histogram and the report.
- View / save / manipulate / print / export the image in the RockPlot2D window.
 Back to P-Data Menu Summary

RockWare home page