RockWorks | ModOps | Grid | Filters | Boolean
This program transforms a real number grid model to a Boolean (true/false) file. In this process, the Z-values of nodes are set to "1" (or other user-defined value) if their original Z-value falls within a user-specified range, and to a "0" (or other user-defined value) if the Z-values do not fall within the range. You can then run the Boolean model through available filters or multiply it to the original model to zero-out areas where your desired criteria aren't met.
Menu Options
Step-by-Step Summary
- Grid Names
- Input Grid: Click to the right to select the name of the existing grid file (.RwGrd file) that the program is to read and manipulate.
- Output Grid: Click here to type in the name to assign to the new "true/false" grid file that the program will create, which results from the Boolean operation.
- Cutoff Levels
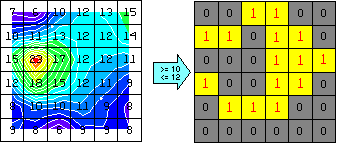
- Minimum Value: Enter the minimum Z-value in the input grid file that is to be assigned a status of "true".
- Maximum Value: Enter the maximum Z-value in the input grid file that is to be assigned a status of "true".
All grid nodes with values less than the Minimum value and greater than the Maximum value will be assigned a status of "false".
- Boolean Values
- Value to be Used for Boolean "True" Values: Enter the real number value to be used to represent "true" nodes in the output model. This is set to "1.0" by default.
- Value to be Used for Boolean "False" Values: Enter the real number value to be used to represent "false" nodes in the output model. This is set to "0.0" by default.
! The benefit of using 0 for False and 1 for True is the results you'll get when you multiply a Boolean grid times a real number model: The nodes that fall outside the desired value range will be set to zero (node x 0 = 0), and the nodes that fall within the desired range will pass unchanged (node x 1 = node)
- 2D Grid Map
Check this box to display the output grid as a 2D map at this time.
Click this tab to set up the 2D map layers (bitmap, symbols, labels, line contours, color-filled contours, labeled cells, map border, etc.).
!You'll probably want to invoke a Boolean color scheme if you turn on color-filled contours.
- 3D Grid Diagram
Check this box to display the output grid as a 3D surface at this time.
Click this tab to set up the 3D map layers (surface colors, images, reference cage, etc.).
! Boolean surfaces in 3D won't make much sense unless you display them a Flat Surfaces.
! You can request both a 2D and 3D representation of the grid model.
- Be sure you have a real number RockWorks grid model (.RwGrd file) already created, for input into this program.
- Select the ModOps | Grid | Filters | Boolean menu option.
- Enter the requested menu settings, described above.
- Click the Process button to continue.
The program will load the input grid file, re-assign the grid nodes whose values lie below the Minimum and above the Maximum the defined value for "False". Those nodes that fall between the Minimum and Maximum will be assigned the declared value for "True." The resulting model will be stored in the project folder under the output grid file name.
The requested diagram(s) will be displayed in a RockPlot2D tab and/or RockPlot3D tab in the Options window.
- You can adjust any of the settings in the Options window and then click the Process button again to regenerate the diagram(s).
- View / save / manipulate / export / print the diagram in the RockPlot2D or RockPlot3D window.
Tips: Since Boolean models contain only two node values, be sure to choose the "Logical" color scheme if you're creating 2D color-interval maps. For both 2D and 2D color-filled maps, you can also create a custom color table where you define the colors to be used for display of the 0 - 0.5 and 0.5 - 1 node values.
Example: Coal volume: Use the Grid | Filters | Boolean tool to read a coal thickness (isopach) grid model (created using either the Utilities tools or the Borehole Manager tools) and set the nodes where thickness exceeds a desired minimum to "true" (1) and the others to "false" (0). Multiply the Boolean model back to the original model (using Grid | Math | Grid & Grid) to zero-out the low-thickness areas. Run the resulting grid model through Grid | Statistics | Report to determine total coal volume in desirable-thickness areas.
 Back to Grid Menu Summary

RockWare home page