RockWorks | Graphics | Animate | XYZ -> 3D Surface Animation
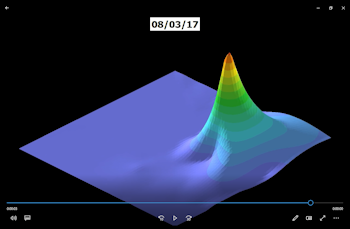
Use this program to read X, Y, date (time), and measurement values from the datasheet, and create 3D surface animations based on the data changes over time (e.g. contamination or groundwater potentiometric surface elevations). These animations may be saved to a variety of video formats.
See also
Create a Contour Animation of Time-Based Data for an animation of 2D maps
Create a 3D Surface Animation of Time-Based Grid Models for an animation based on existing grids
Feature Level: RockWorks Basic and higher
Menu Options
Step-by-Step Summary
- Data Columns: Use these prompts to tell RockWorks which columns in the current Datasheet contain the input data.
- X (Easting): Column that contains the X coordinates for the sample points.
These can be Eastings in meters or feet, decimal longitudes, etc. See Defining your Datasheet Coordinates for more information.
- Y (Northing): Column that contains the Y coordinates for the center of the images.
These must be the same coordinate system and units as the X coordinates.
- Date (Time): Column that contains the dates on which the samples were taken. This can include dates only, or dates and time.
- G (value): Select the column that lists the data to be contoured, such as contaminant concentrations or water level elevations.
- Duration
- Manually Specify Duration: If left unchecked, the animation will be automatically computed based on the oldest and most recent sampling dates. If checked, you can manually choose the starting and ending dates for the animation.
- Include Time within Dates: Check this box if you have time of day included in the Date column of values and wish to be able to specify those for the animation duration.
- Sampling Interval: Use this prompt to select how the data are to be grouped by time/date. RockWorks will use this setting to filter the points when generating the initial grids for the animation.
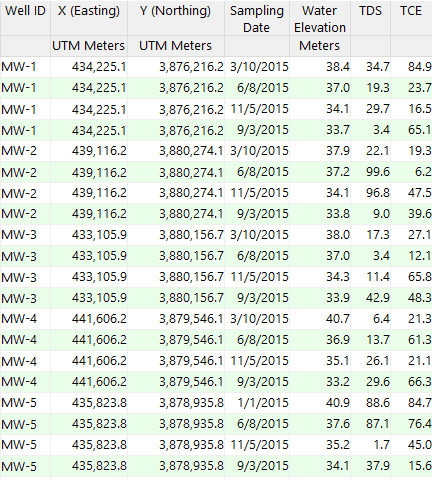
For example, consider a site that has been sampled on a quarterly basis, starting on January 1st, 2015. If the sampling interval is set to "quarters", all samples between Jan 1, 2015 and Mar 31, 2015 will be used to make the first grid. All samples collected between Apr 1, 2015 and Jun 30, 2015 will be used to make the next grid, and so on. This is how you can accommodate that sampling for a given period doesn't necessarily occur at exactly the same moment.
NOTE: The Sampling Interval does not determine the number of transitional maps that are created between the sample intervals. Instead, the number of transitional frames is defined within the Output Options (described below).
- Gridding Method:
- Dimensions: Click this tab to view/change the dimensions (extents and node spacing) of the grid model. (More info.)
- Algorithm: Click this tab to choose the gridding method that will be used to interpolate the grid models through time. (More info.)
- Options: Click this tab to access the various gridding options such as smoothing, declustering, etc. (More info.)
- Grid Display: Click this tab to set up the 2D map layers (bitmap, symbols, labels, line contours, color-filled contours, labeled cells, map border, etc.).
- Other 3D Diagram Options
Use these checkboxes to append other layers to the 3D scene.
Click each tab to set up the 3D diagram layers (images, infrastructure, reference cage, etc.).
- Output Options: Use these settings to define the animation output file type and display settings. (More info)
- Access the RockWorks Datasheet program tab.
- Create a new datasheet and enter or import your sample locations, dates, and measurements into the datasheet.
Or, open one of the sample files and replace that data with your own.
! Click the Example button at the top of the window to load a sample file that is installed with the program.
Longitude and latitude coordinates must be in decimal format. If you're using another coordinate system, be sure you've specified the Units and the Projection Settings as appropriate. Be sure your Width and Height column units are defined.
- Select the Graphics | Animate | XYZ -> 3D Surface Map Animation menu option.
- Enter the requested menu settings, described above.
- Click the Continue button to proceed.
RockWorks will read the locations, dates and measurements from the input columns. It will generate grid models and 3D surfaces for the requested intervals using the specified options. The images will be output to PNG images based on the requested settings, storing them with the specified file name prefix in the Animation_Frames subfolder in your project. The images will be output to the requested animation type. The animation will be displayed in the default viewer as selected.
 Back to Animate Menu Summary

RockWare home page