RockWorks | Graphics | 2D Tools | Enclosing Polygon
This program is used to read a list of enabled boreholes from the project database OR a list of XY points from the datasheet, and calculate the vertices of a convex polygon to enclose them. The offset of the polygon from the points is user defined. The polygon vertices can be recorded to the datasheet, a text file, Excel, or RTF format. The polygon can be displayed in a map with a variety of map layers.
This is an automatic method of generating a polygon surrounding sample locations, which can be used to clip grid and solid models and to limit volume and other calculations. This is the same "convex hull" process as is offered during model generation, with the Automatic Polygon Clipping in Grid Model Options and Solid Model Options.
Feature level: RockWork Basic and higher
Menu Options
Step by Step Summary
- Options
- Data Source: Define the source of the points around which the polygon vertices will be calculated.
- XY Points within Datasheet: Choose this option if the control point locations are listed within the current datasheet.
- X Column: Select from the drop-down list the name of the column which contains the X coordinates of the points.
- Y Column: Select the name of the column in which the Y coordinates for the points are listed.
- Enabled Borehole Collars: Choose this option if the control points are represented by the enabled boreholes in the project database.
- Offset Distance: This setting defines how close to the outermost control points the polygon will be positioned. If you enter 0, the polygon will pass through the outermost points. To offset the polygon perimeter from the points, enter an offset in your map units.
- Border Style: Click the graphic line sample to choose a line thickness, color, and style for the polygon which will plot in the output map.
- Vertex Table: Click this tab to define the output format(s) for the listing of the polygon vertices. You can choose multiple options. (More info)
- RwDat (RockWorks): Click in this button if you want the vertices recorded in a RockWorks datasheet (.RwDat) format.
- CSV (Excel): Click in this button if you want the vertices recorded in a CSV file format for use in Excel.
- TXT (Notepad): Click in this button if you want the vertices recorded in a text (.txt) format.
- RTF (Word): Click in this button if you want the vertices recorded in an RTF file format for use in Word.
- 2D Map Options
Use these checkboxes to append other layers to your map.
Click each tab to set up the 2D map layers (bitmap, symbols and labels, map peripherals, map border, etc.).
- Output Options: Use these settings to define whether the output graphic is to be saved (or displayed as "untitled"), how the file should be named, and whether it is to be displayed after it is created. It also offers export options. (More info)
Follow these steps to calculate and display a convex hull polygon around map points.
- Prepare the data source:
- If the points are in an RwDat file, click on the Datasheet program tab and open the RwDat file which lists the control point X and Y coordinates.
- If the control points are in the project database, be sure the boreholes to be used are enabled.
- Select the Graphics | 2D Tools | Enclosing Polygon menu option.
- Enter the requested settings, described above.
- Click the Continue button to proceed.
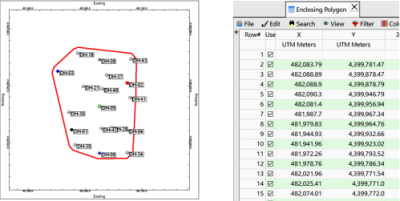
RockWorks will calculate the outermost coordinates of the point cluster, plus any offset you have defined, and calculate the vertices of the polygon to surround them. It will plot the polygon, along with other activated map layers, in a RockPlot2D tab in the Options window. The list of the polygon vertex coordinates will be stored in the requested output format(s) and displayed if requested.
- You can adjust any of the program settings via the main Options button to the left, and click the Continue button to regenerate the listing and map.
- View / save / manipulate / print / export the image in the RockPlot2D window.
 Back to 2D Tools Menu Summary

RockWare home page