This section of the Borehole Manager tutorial contains lessons for creating diagrams to illustrate downhole data that is entered into the project's Time-Interval (T-Data) tables. T-Data simply refers to downhole samples that are measured over depth intervals and which have a date/time record which can be used as a filter for modeling and display. The T-Data table is commonly used for entry of contaminant data, such as geochemical values taken from monitoring wells.
If you have already done the I-Data lessons, these procedures will be very much the same. However, the modeling will be restricted to measurements on a specific date and constrained within aquifer surfaces.
Pick a lesson by clicking on its arrow. We recommend going through these lessons in the order listed. Those marked with "*" are required for subsequent lessons.
![]() If this is the first lesson set you’ve done, please be sure you’ve (1) opened a project folder, (2) restored the program defaults, and (3) set the project dimensions.
If this is the first lesson set you’ve done, please be sure you’ve (1) opened a project folder, (2) restored the program defaults, and (3) set the project dimensions.
| Tutorial Lesson | Minimum licensing level | |
| Look at the Time Interval (T-Data) layout. See how the data columns, dates, and values are defined, how to edit the data as a "datasheet", and how to query based on T-Data values. |
Basic |
|
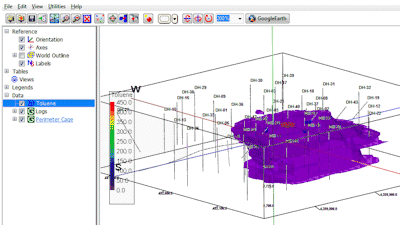
| Display T-Data logs in 3D.* This offers a quick, overall view of the Toluene measurements for a specific date. |
Basic (or Trial) |
|
| Display T-Data logs in a 2D cross section. This shows the Toluene measurements for selected boreholes for a selected date in a multi-log cross section diagram. |
Basic (or Trial) |
|
| Create a 3D aquifer model.* The surfaces representing the water levels will be used to constrain the time-data model in the following lesson. |
Standard (or Trial) |
|
| Create a T-data isosurface diagram.* Here you will interpolate the log data into a continuous solid model and display it as an isosurface. |
Standard (or Trial) |
|
| Create an interpolated T-Data profile. Using the interpolated model from above, you'll display a single slice in a profile diagram, with 2D logs. |
Standard (or Trial) |
|
 |
Create a T-Data isosurface diagram for a different date. Here you will quickly create water level surfaces and a new solid T-Data model for a different sampling date. |
Standard (or Trial) |
| Create a morphed model animation. In this lesson you will use the RockWorks morphing tool to create a 3D animation between two toluene models, and to create an AVI file. |
Standard (or Trial) |
"*" lessons are required for subsequent lessons.
![]() Back to main menu
Back to main menu
![]()